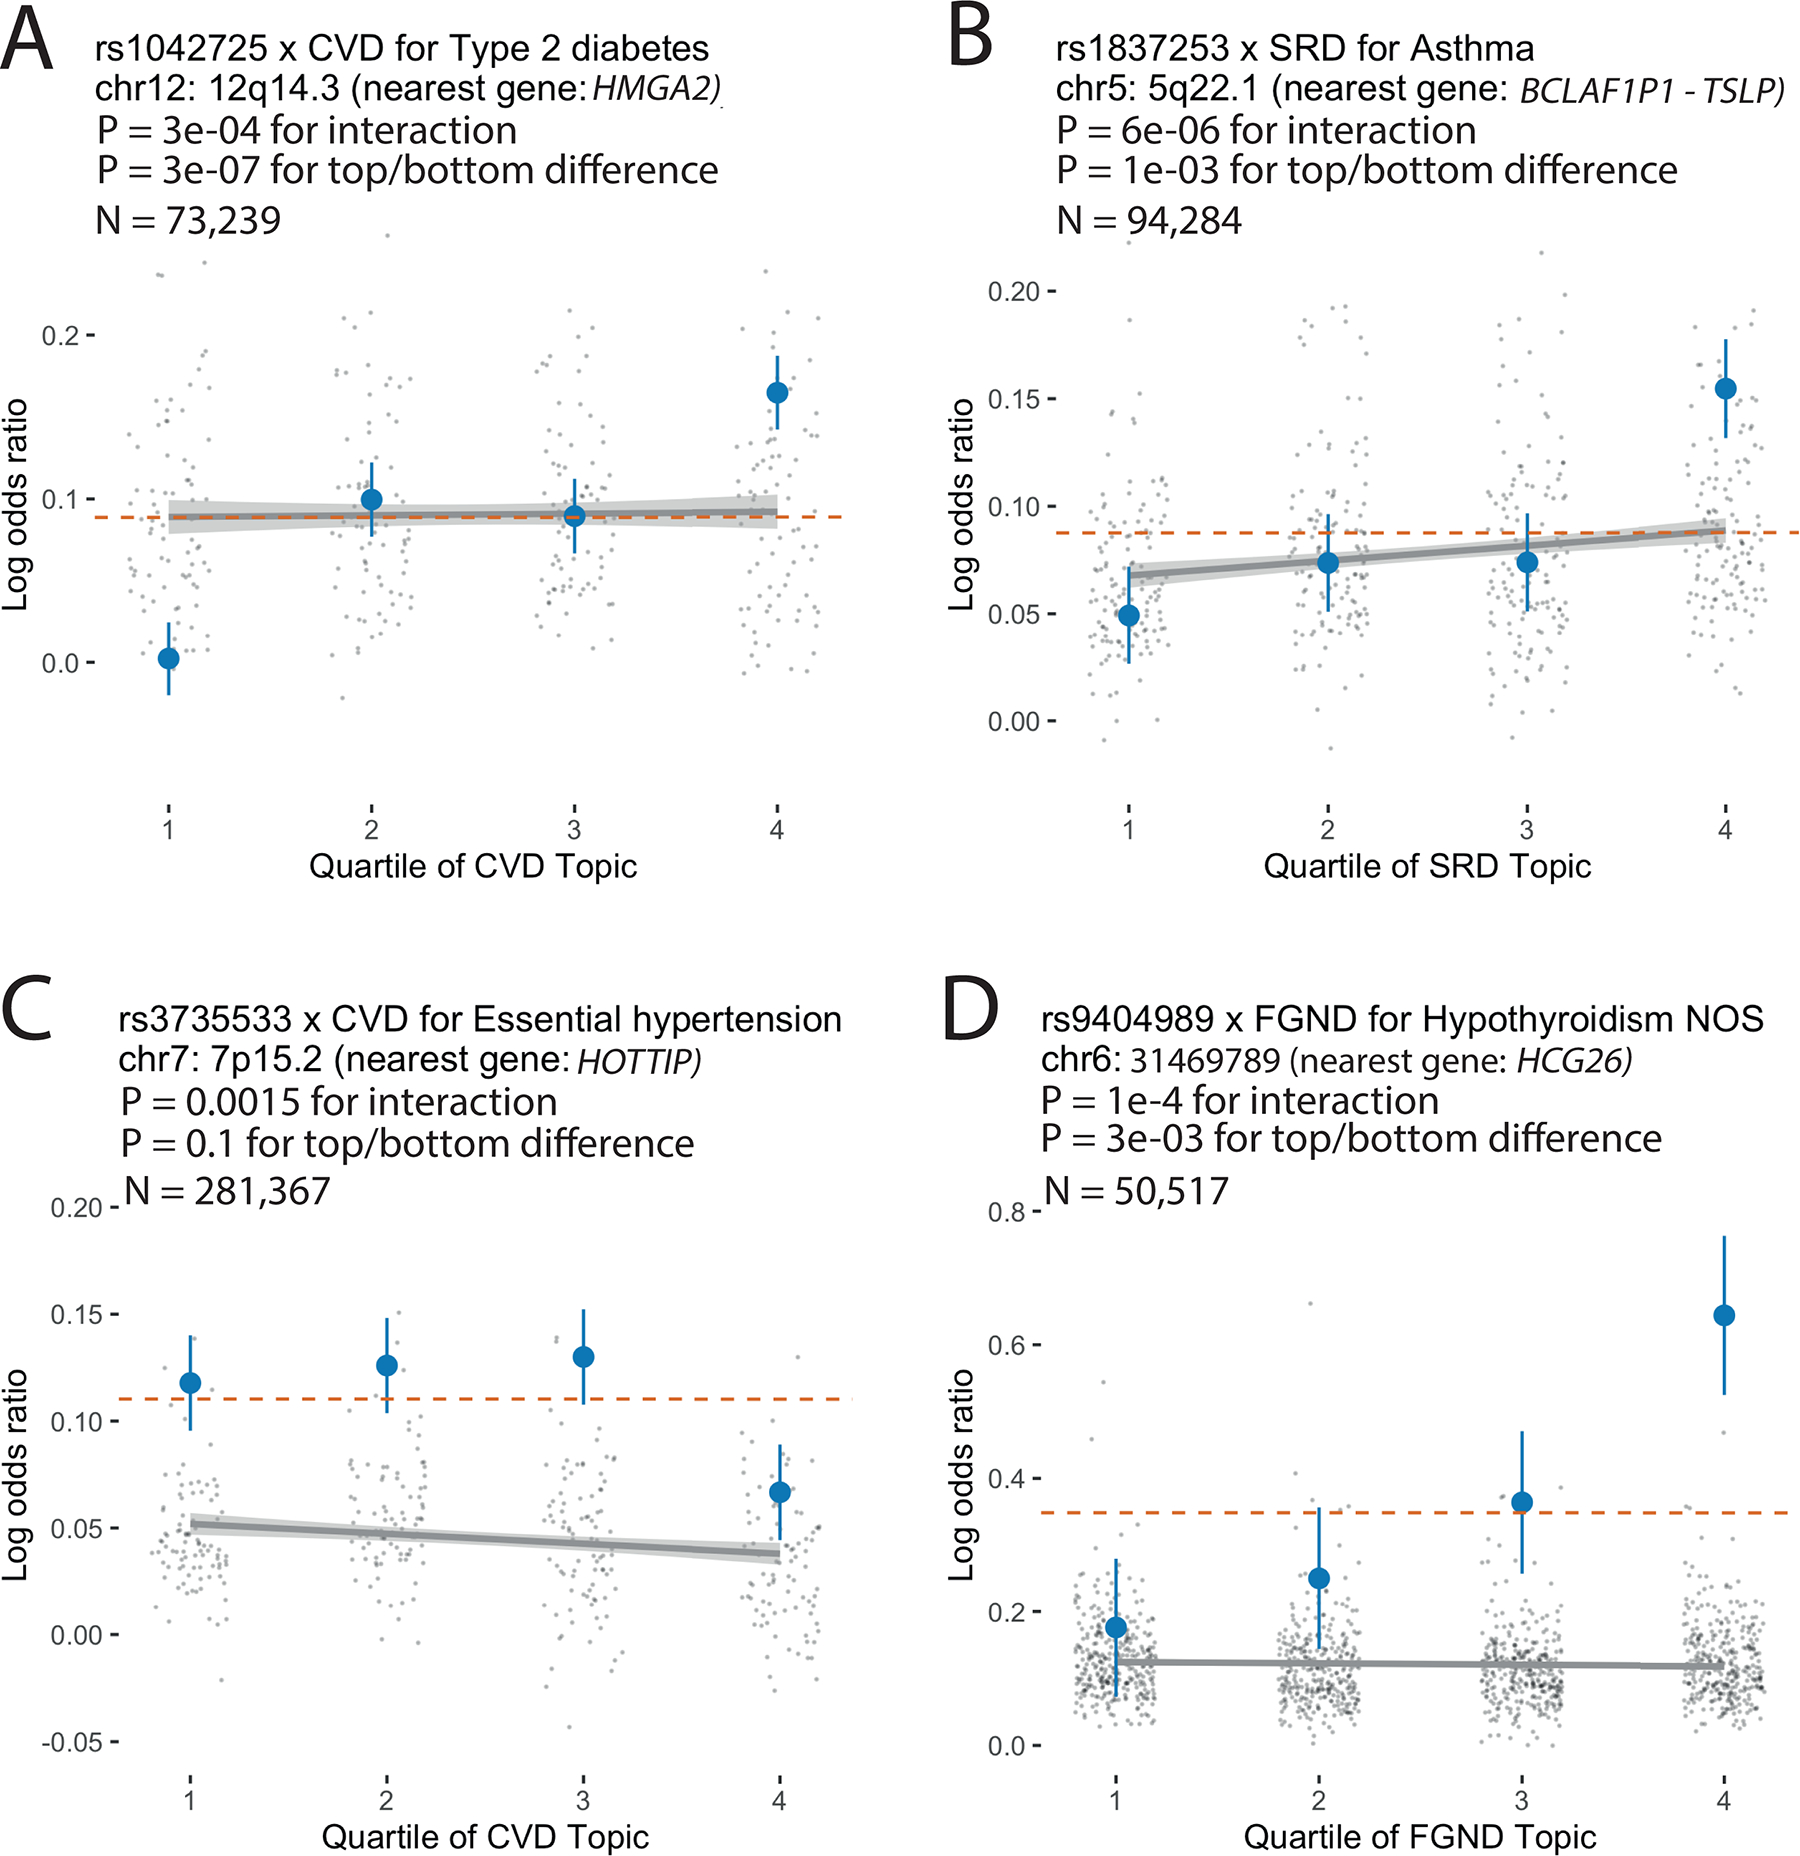
Extended Data Fig. 8. Examples of SNP × topic interaction effects on disease phenotypes.

For each example, we report main SNP effects (log odds ratios) specific to each quartile of topic weights across individuals, for both the focal SNP (blue dots) and background SNPs for that disease and topic (genome-wide significant main effect (P < 5×10⁻⁸) but non-significant SNP × topic interaction effect (P > 0.05); grey dots). Dashed red lines denote aggregate main SNP effects for each focal SNP. Error bars denote 95% confidence intervals. Grey lines denote linear regression of grey dots, with grey shading denoting corresponding 95% confidence intervals. P-values for interaction are for testing the interaction regression coefficients; P-values for top/bottom differences are for two-sided t-test. Numerical results are reported in Supplementary Table 18.
