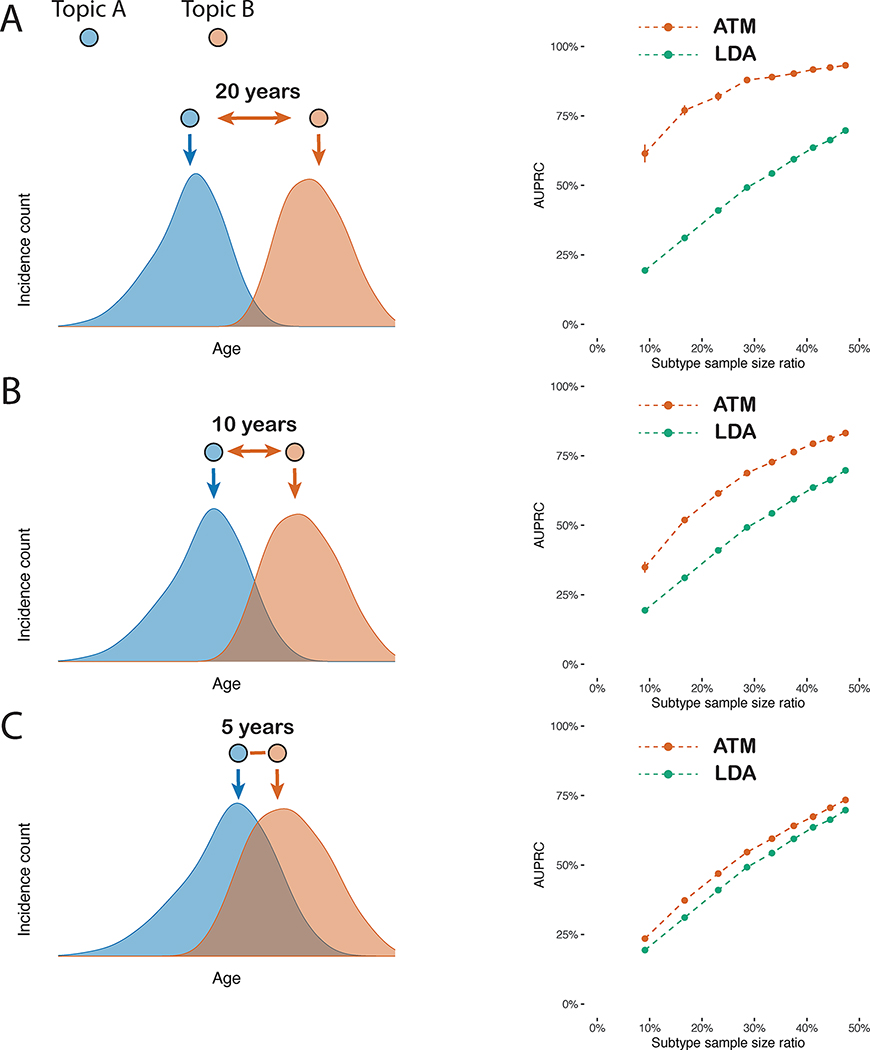
Fig. 2 |. ATM outperforms LDA in simulations with age-dependent effects.
In simulations at different levels of age-dependent effects (left panels), we report the area under the precision and recall curve (AUPRC) for ATM vs. LDA as a function of subtype sample size proportion (the proportion of diagnoses belonging to the smaller subtype) (right panels). Each dot represents the mean of 100 simulations of 10,000 individuals. Error bars denote 95% confidence intervals. a, 20-year difference in age at diagnosis for the two subtypes. b, 10-year difference in age at diagnosis for the two subtypes. c, 5-year difference in age at diagnosis for the two subtypes. Numerical results are reported in Supplementary Table 2.

