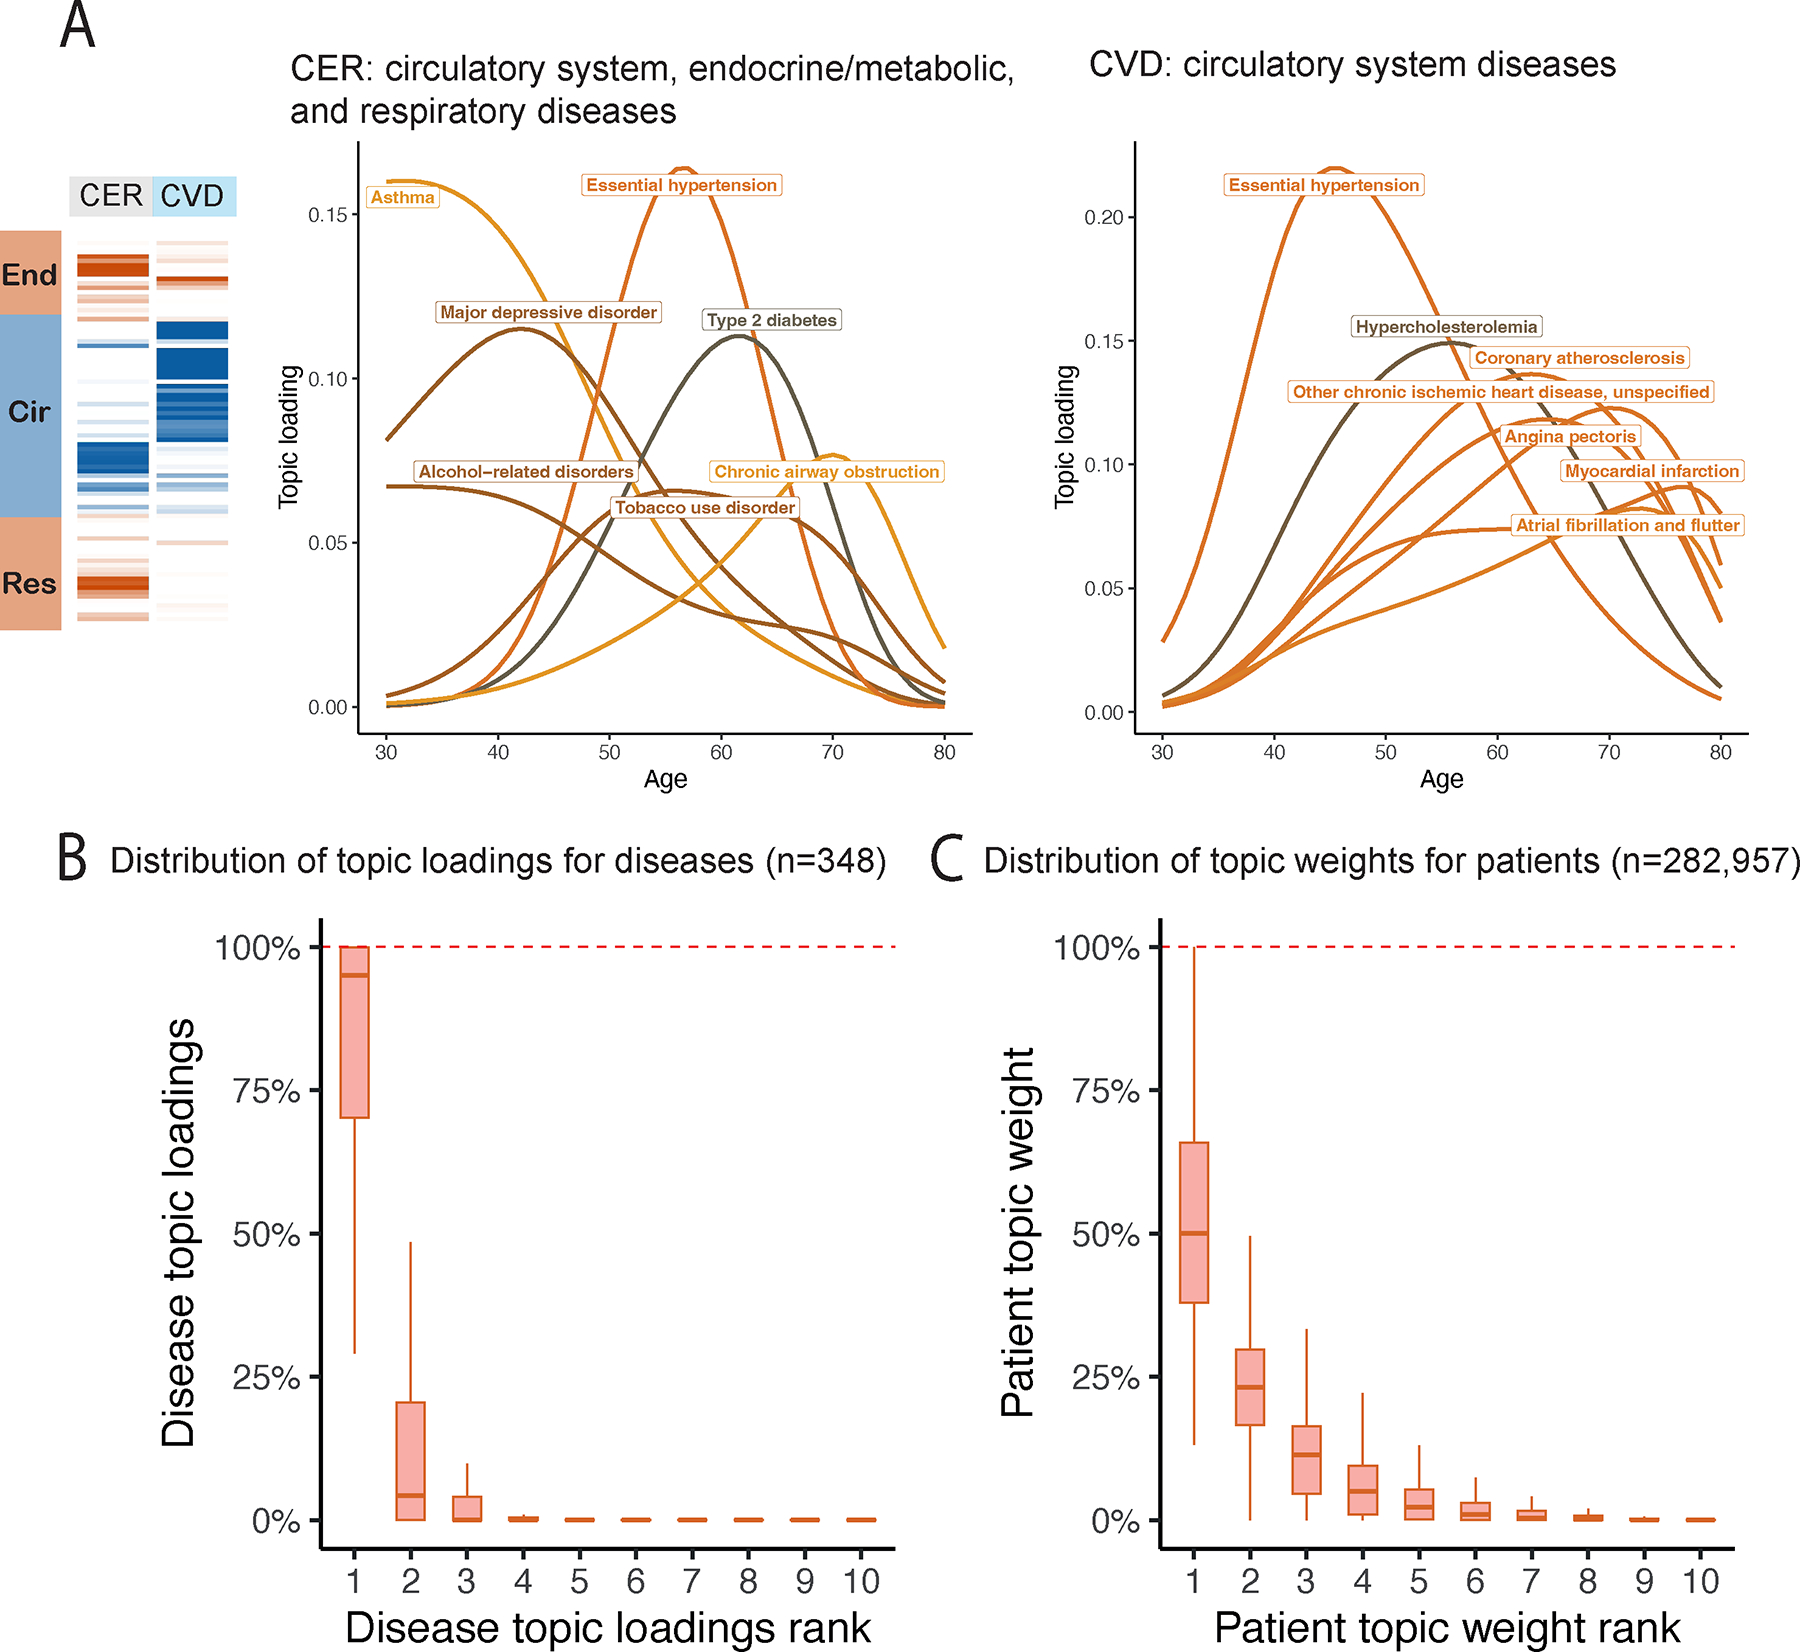
Fig. 4 |. Topic loadings in UK Biobank capture age-dependent comorbidities.

a, Age-dependent topic loadings for two representative topics, CER and CVD; for each topic, we include the top seven diseases with highest topic loadings. Results for all 10 topics are reported in Supplementary Figure 9. b, Box plot of disease topic loading as a function of rank; disease topic loadings are computed as a weighted average across all values of age at diagnosis. c, Box plot of patient topic weight as a function of rank. Centre, box bounds, and whisker ends denote median, quartiles, and minima/maxima. Numerical results are reported in Supplementary Table 5.
