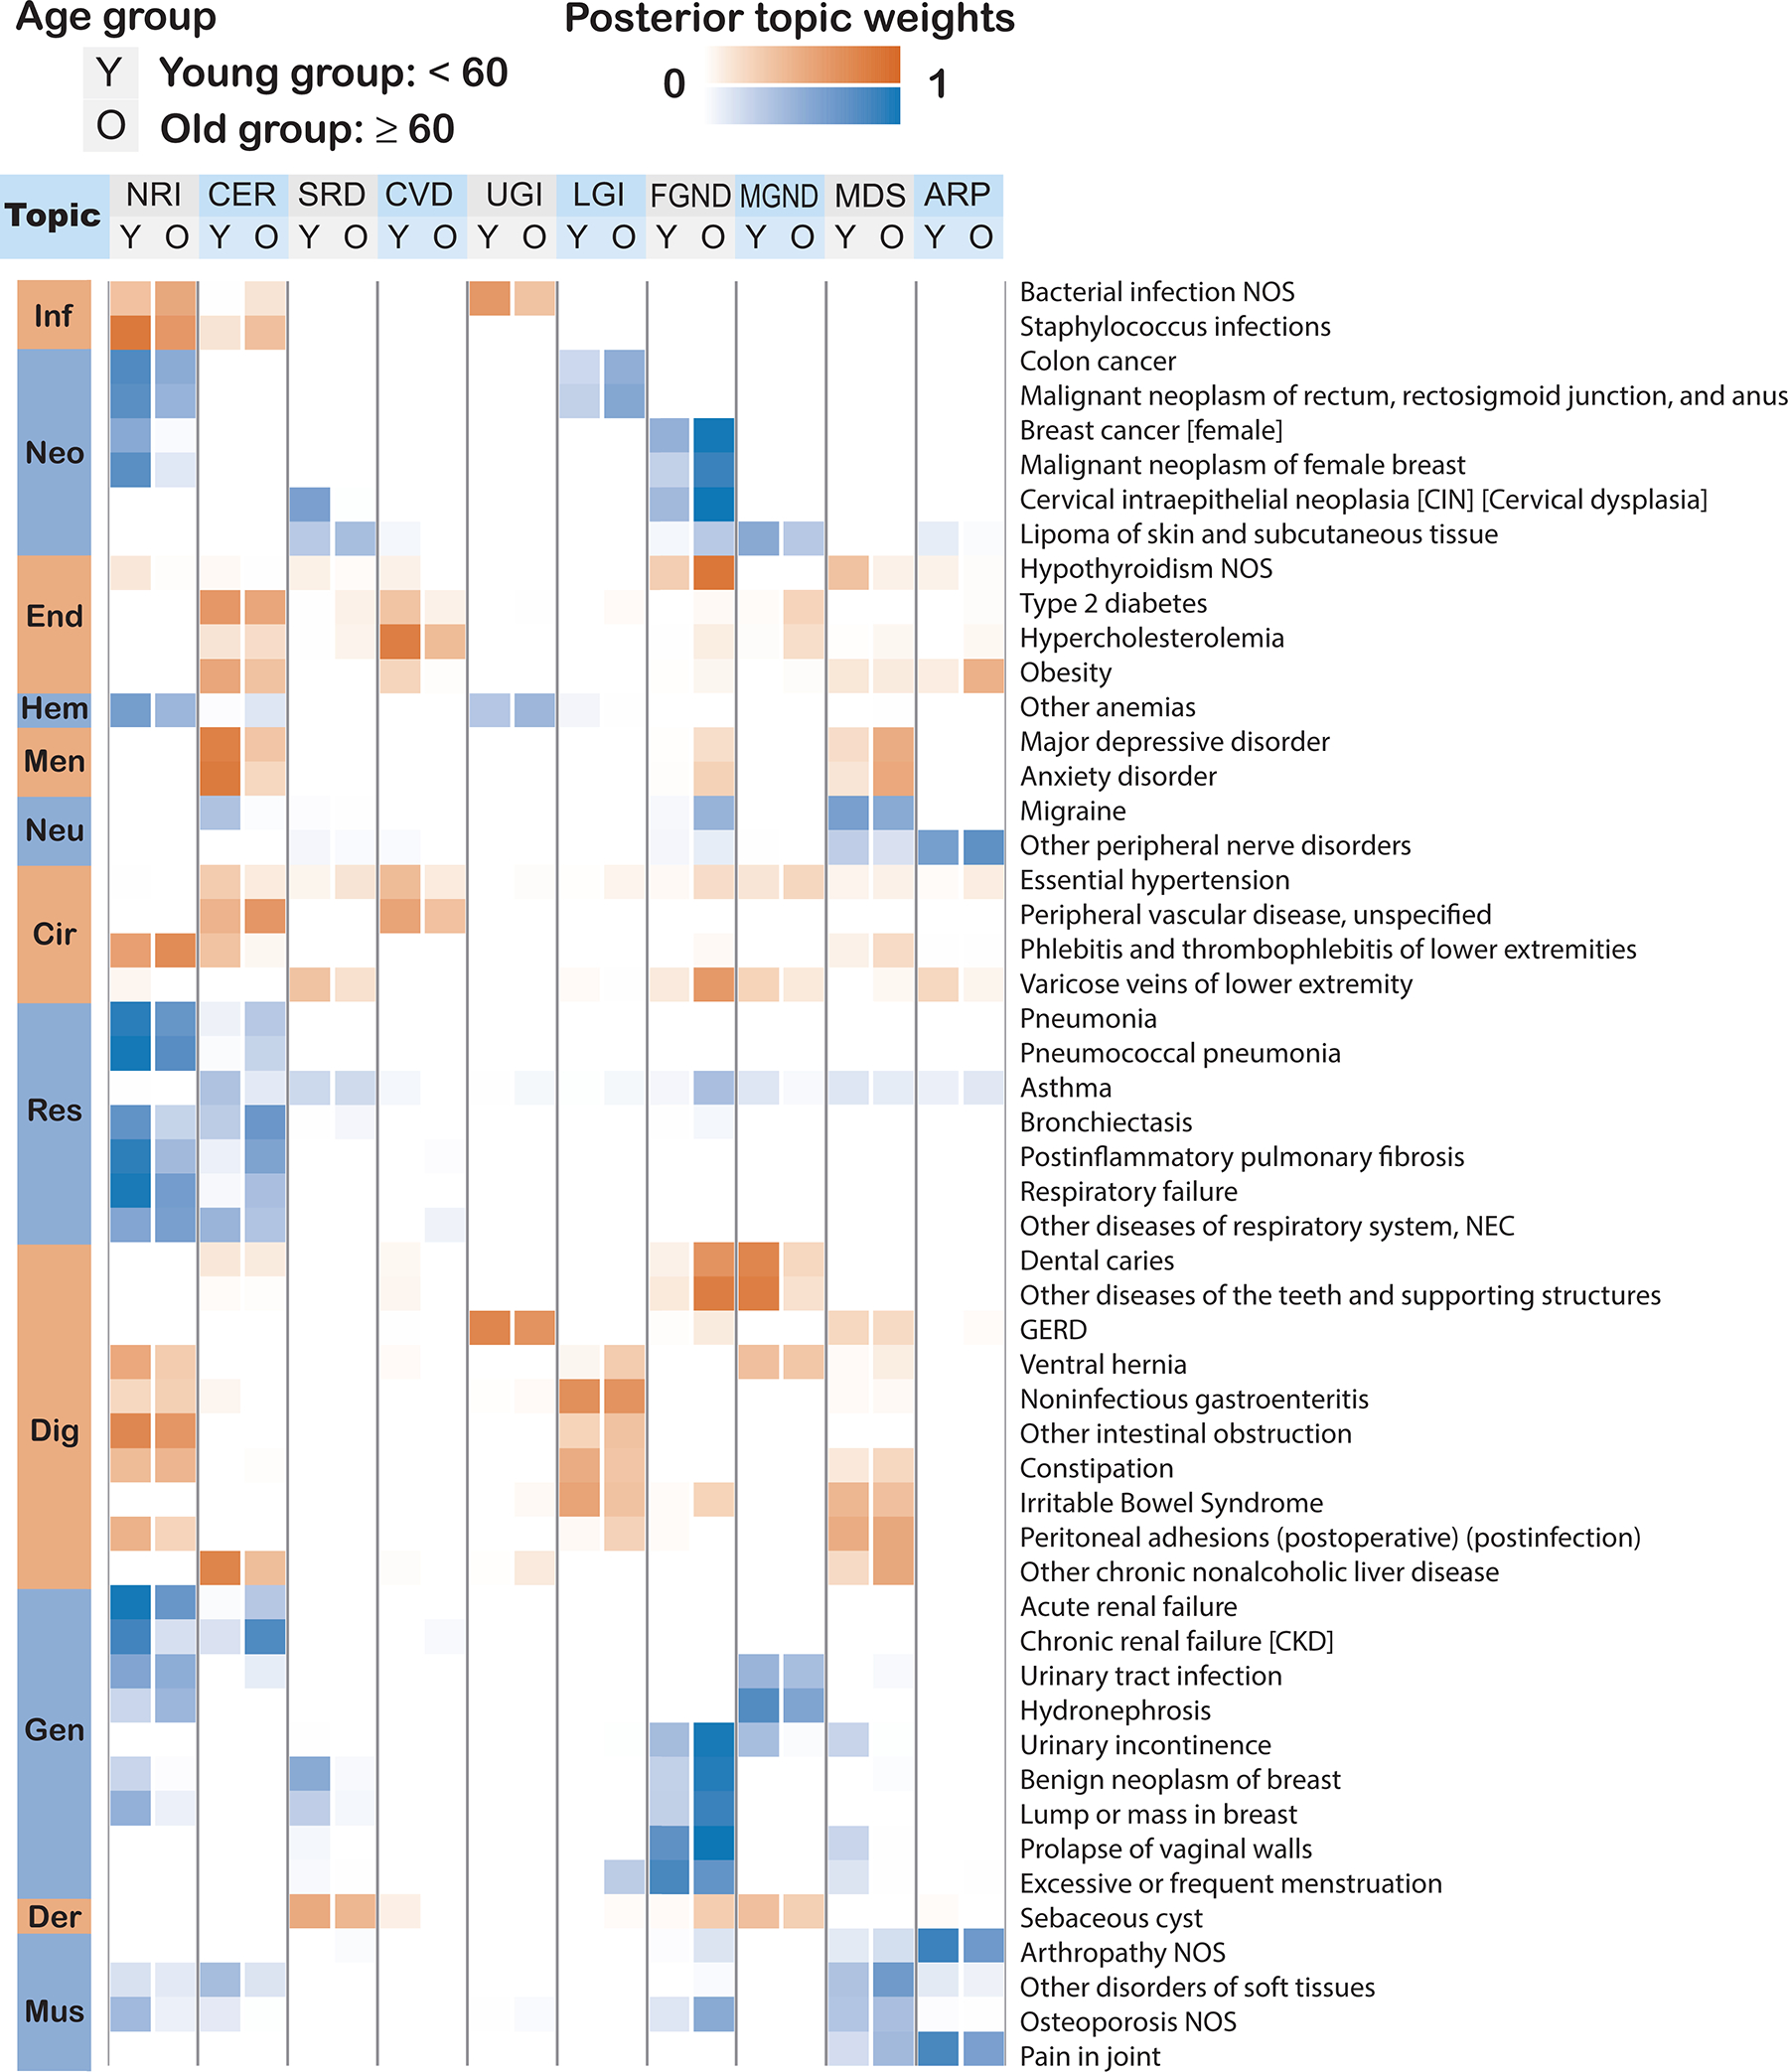
Extended Data Fig. 2. Posterior topic distributions are different between age groups for diseases that have subtypes.

The figure has the same legends as Fig. 3A but focusing on 52 diseases that have a subtype with at least 500 incidences. Distribution of average topic assignment for these 52 diseases is reported in Supplementary Fig. 15.
