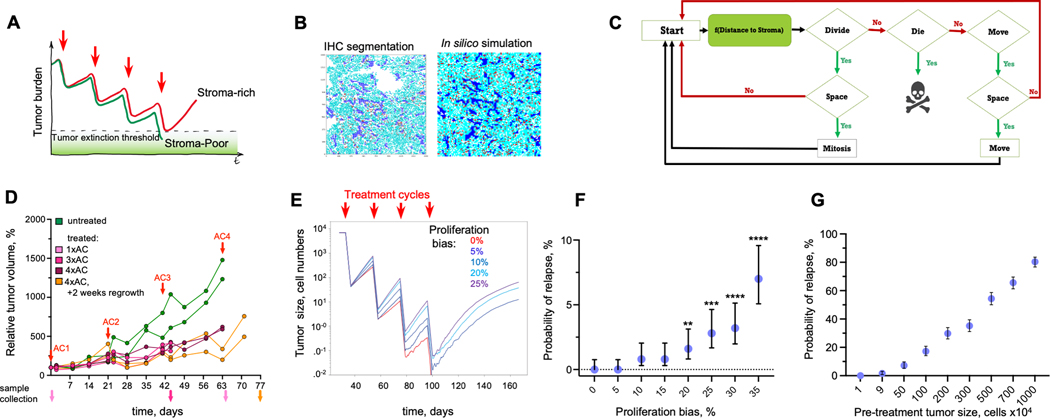
Figure 3. In silico validation of the hypothesized indirect stroma-mediated chemoresistance.
A. Model schemata depicting the hypothesized indirect stroma-mediated chemoresistance. Enhanced proliferation in stroma-rich tumors can enhance between-chemo cycles recovery of tumors, enabling them to escape therapeutic eradication. B. ABM is initiated based on the spatial localization of tumor cells and stroma observed in the indicated experimental sample. C. Diagram of the ABM model. D. Dynamics of volume changes in MDA468 xenograft tumors over the course of AC treatment (0.5 mg/kg doxorubicin and 50 mg/kg cyclophosphamide), injections times are indicated by red arrows. Traces indicate individual tumors; distinct colors of volume traces indicate tumors harvested at different time points, indicated by arrows of matching colors. E. Impact of the indicated magnitude of enhancement of cell proliferation within 3 cell diameters from stroma border on the average population size over the course of chemotherapy. Traces depict average population sizes over 500 simulations per condition. F. Impact of the indicated magnitude of enhancement of cell proliferation on the probability of tumor relapse through the course of therapy, over 500 simulations with 95% confidence interval. ****, ***, ** indicate p-values of <0.001, <0.001, and 0.0076, respectively, of Fisher exact test, comparing the probability of relapse with indicated proliferation bias against the simulations without stromal effect (proliferation bias 0%). G. Dependence on the sampling grid size of the tumor relapse for the simulations under short-term cytotoxic effects of the chemotherapy under 5% bias in proliferation due to stromal effects. For each data point, 500 random samplings of groups of 1,9,50, 100, 200, 300, 500 700, and 1000 simulations have been randomly selected from 10,000 simulations of 100×100 grids. Error bars depict 95% confidence intervals

