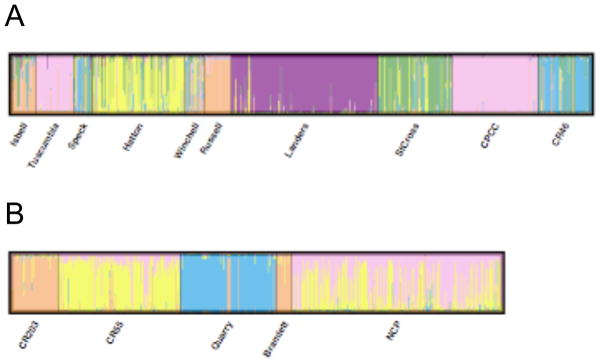
Figure 3.
Bar plot of assignment of individual genotypes to each of k subpopulations using the clustering method of the program Structure: (A) L. alabamica individuals were assigned to 6 subpopulations, (B) L. crassa individuals were assigned to 4 subpopulations. The different colors in each plot represent the k subpopulations. Physical populations sampled for each species are also shown.

