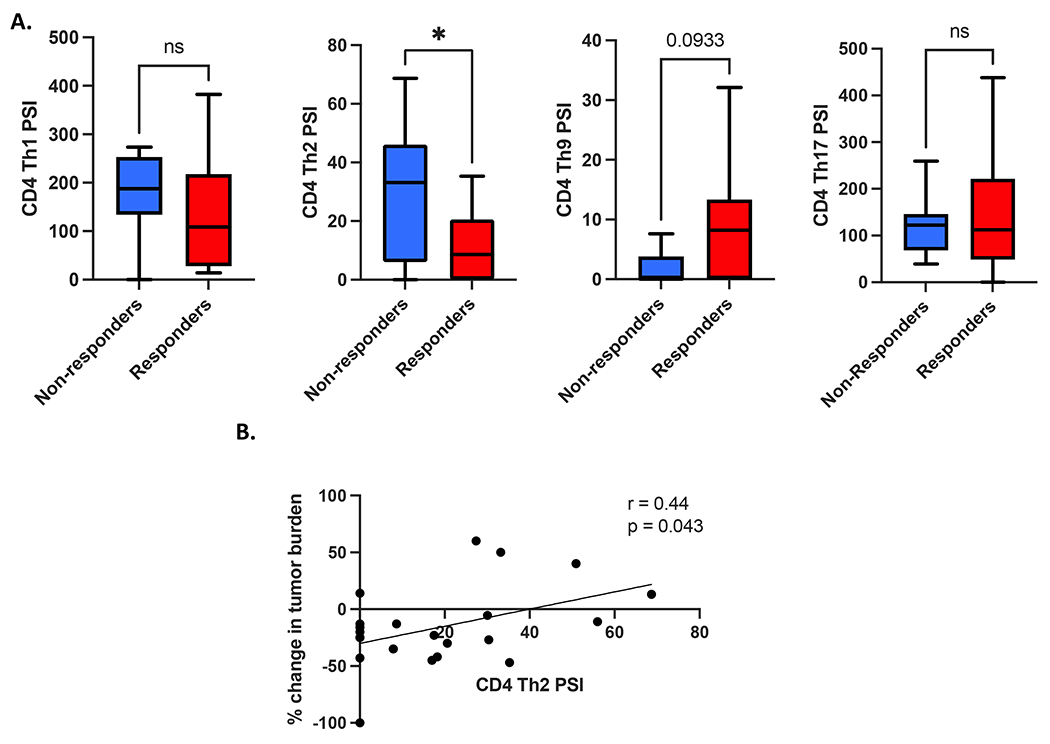
Figure 2. CD4+ Th2 cell cytokine polyfunctionality is associated with inferior clinical response to transgenic TCR T-cell therapy.

(A) Comparison of different CD4+ Th cell cytokine polyfunctionality profiles between clinical responders and non-responders to TCR T-cell therapy (Th1 = IL2, IFNγ, Th2 = IL4, IL5, IL10, and IL13, Th9 = IL9, Th17 = IL17A, IL17F, IL22). CD4+ Th2 cell polyfunctional strength index (PSI, i.e. proportion of single cells secreting Th2 cytokines IL4, IL5, IL10, and IL13 multiplied by the signal intensity of those cytokines) is significantly greater in clinical non-responders to therapy (n = 10) vs responders (n = 17). (B) CD4+ Th2 cell PSI is associated with inferior peak change in tumor burden per RECIST1.1 criteria. All box and whisker plots represent median at dividing line, with interquartile range represented by boxes, and lines representing minimum and maximum values for each dataset, and are compared by unpaired t-test (*p<0.05), while all correlation plots represent Pearson’s r values. Each sample was run as an independent experiment, and data were aggregated by clinical response for analysis.
