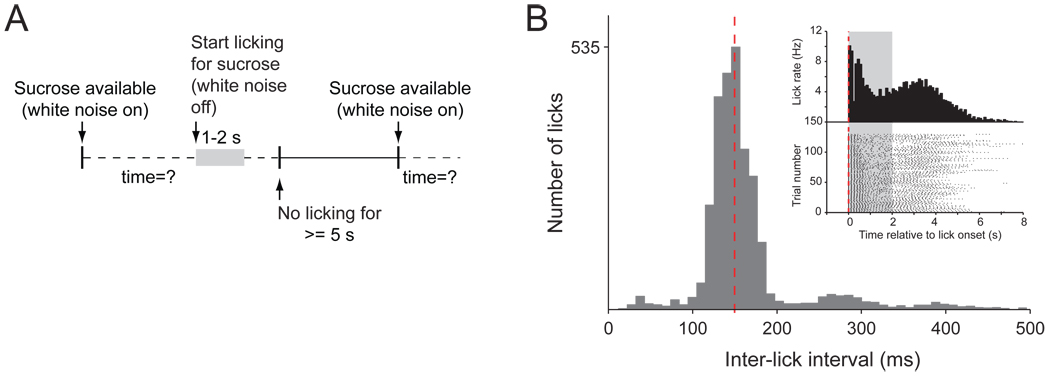
Figure 1.
Behavior during sucrose consumption. (A) Diagram of the behavioral task. White noise in the operant chamber indicates the sucrose availability (gray area). The sucrose valve opens upon the first lick, and stays open for a preset duration. In order to initiate the next trial the rat had to withold licking for at least 5 s. (B) Interlick interval histogram of a representative session. The peak frequency of licking is 7 Hz (140 ms ILI: red dashed line). Inset: peri-lick interval histogram (top) and raster plot of licking represented for each trial in the session (bottom).

