Figure 5.
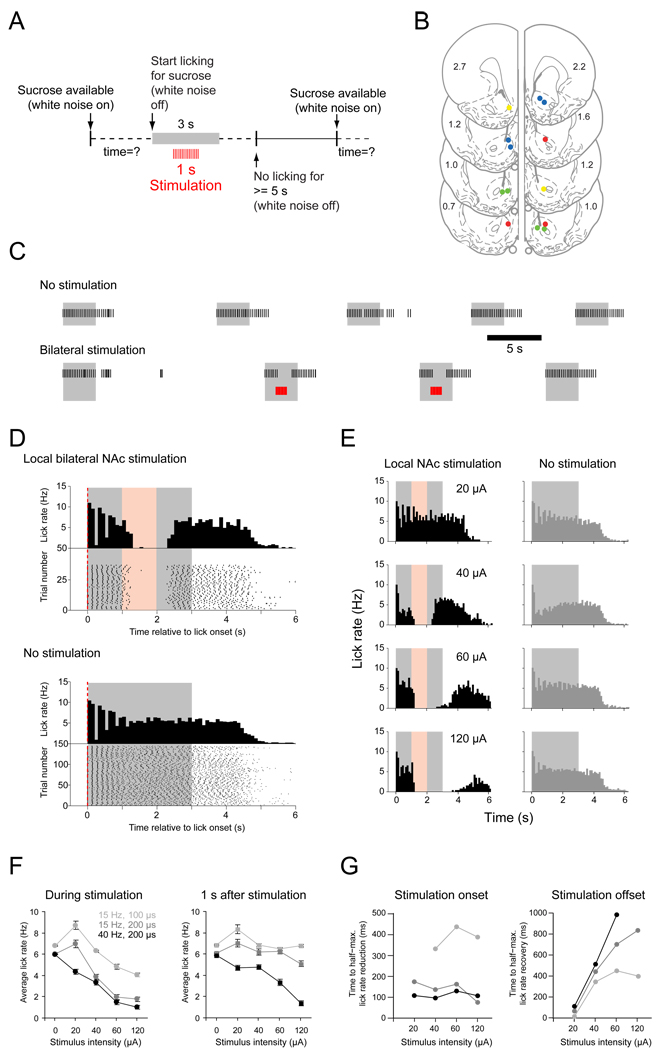
Bilateral local stimulation in the NAc shell disrupts licking. (A) Schematic of the experimental paradigm. (B) Anatomical location of stimulation sites used simultaneously for bilateral stimulation (2–4 sites) in 4 rats coded by 4 colors (coronal schematics and AP coordinates are taken from the Paxinos and Watson rat atlas). (C) Example epochs from a session of sucrose licking before and during pseudo-random stimulation. Each black line in the raster plot represents a lick. In this and all other panels of this figure the gray area represents the timing of sucrose delivery and the red area the timing of local NAc stimulation. (D) Peri-lick interval histograms and lick raster plots of local stimulation. Stimulation trains were delivered pseudo-randomly in 20% of the trials during the session, but for the purpose of illustration stimulated (left column, stimulation duration in red) and non-stimulated (right column, dark gray histograms) trials are pooled and shown in separate diagrams. (E) The degree of lick disruption scales with stimulation intensity. Examples of peri-lick interval histograms of stimulated (left) and non-stimulated (right) trials (D and E: 100 ms bin size). (F) Data summary (n = 4 rats) of the effect of local stimulation on average lick rate (and SEM) during the time of stimulation (left) and during one second following stimulation (right). (G) Time to half-maximal lick suppression during stimulation onset (left) and half-maximal recovery following stimulation offset (right) for all stimulation intensities tested.

