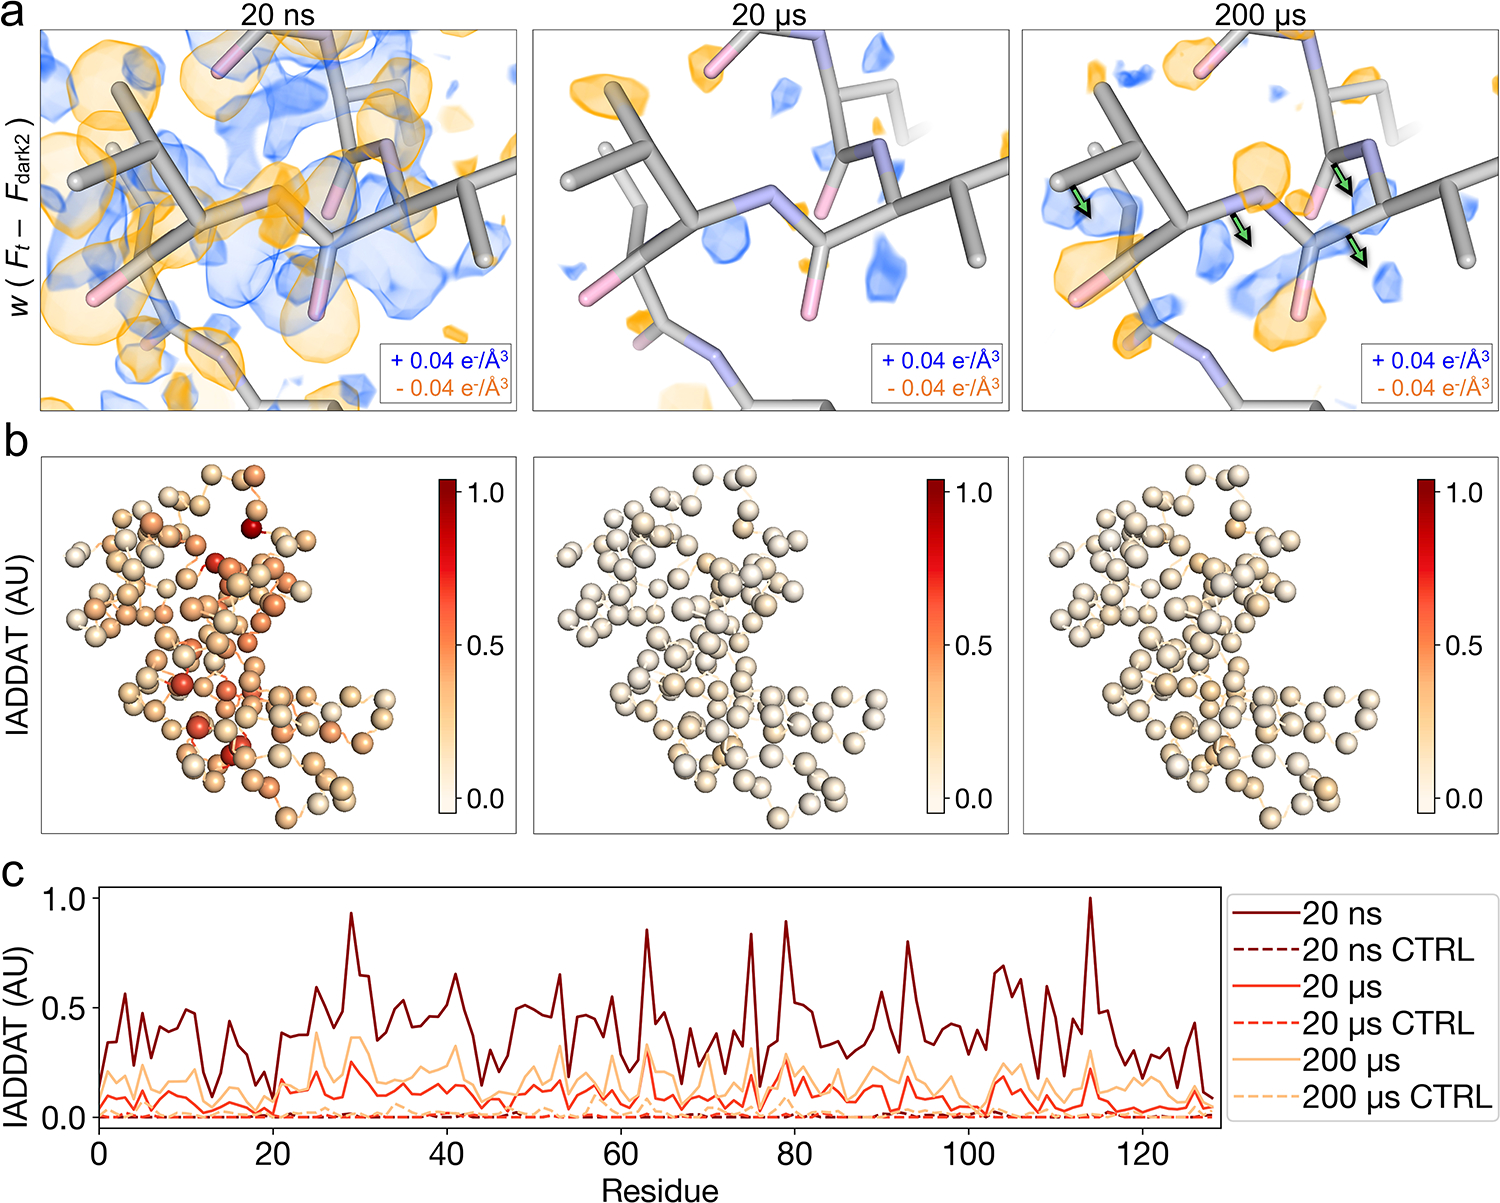
Figure 3. Time-resolved difference electron density evolves over time following T-jump.

(a) Comparison of weighted difference electron density maps () for each pump-probe time delay, centered around residues 97–100. Maps were visualized at an absolute contour level of ± 0.04 e−/Å3 alongside corresponding refined models. While model coordinates appeared stable across pump-probe time delays, difference maps revealed time-resolved changes to the T-jump induced signal, with evidence for coordinated motions (green arrows) apparent by 200 μs. (b) IADDAT was calculated as an average value per residue for each pump-probe time delay, then mapped onto C-alpha positions (spheres) of the respective model, and plotted as a function of residue number (c). Comparison of IADDAT values for experimental maps relative to matched controls revealed low levels of noise across the series.
