
Figure 5. Chitobiose binding perturbs changes induced by T-jump.
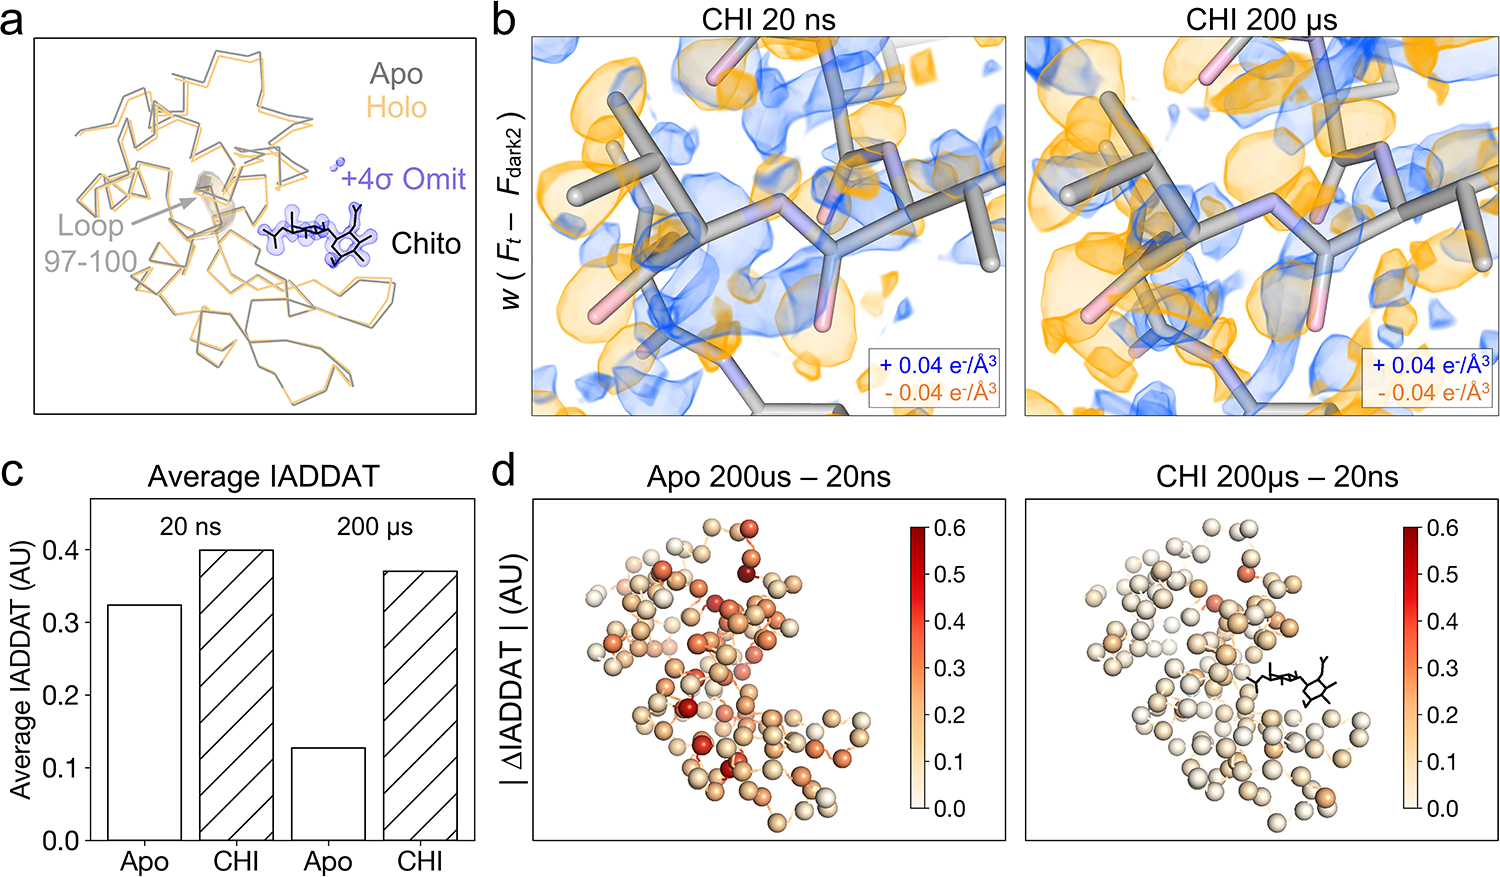
(a) Ribbon diagrams of lysozyme structures (laser off) in the apo (gray) and chitobiose-bound (holo, orange) forms show a decrease in distance between the two lobes of the protein upon ligand binding, characteristic of the active site “closing” motion. Chitobiose is shown as black sticks, along with a ligand omit map contoured to +4σ and carved within 5 Å of the chitobiose molecule. (b) Visualization of weighted difference density maps for chitobiose-bound data sets show similar in the apo and ligand-bound states. Maps were visualized at an absolute contour level of ± 0.04 e−/Å3 alongside initial refined models for each pump-probe time delay. (c) Comparing average IADDAT values for ligand-bound and apo maps revealed similar signal levels at 20 ns, with substantial differences appearing by 200 μs. (d) Mapping absolute differences in IADDAT between 20 ns and 200 μs ( |ΔIADDAT| ) values onto the structure (C-alphas as spheres) further reveals that time-resolved changes are more pronounced for the apo enzyme than for the inhibitor-bound enzyme.