
Extended Data Fig. 2. Simulations of increased B-factors recapitulate signals present at the 20 ns pump-probe time delay.
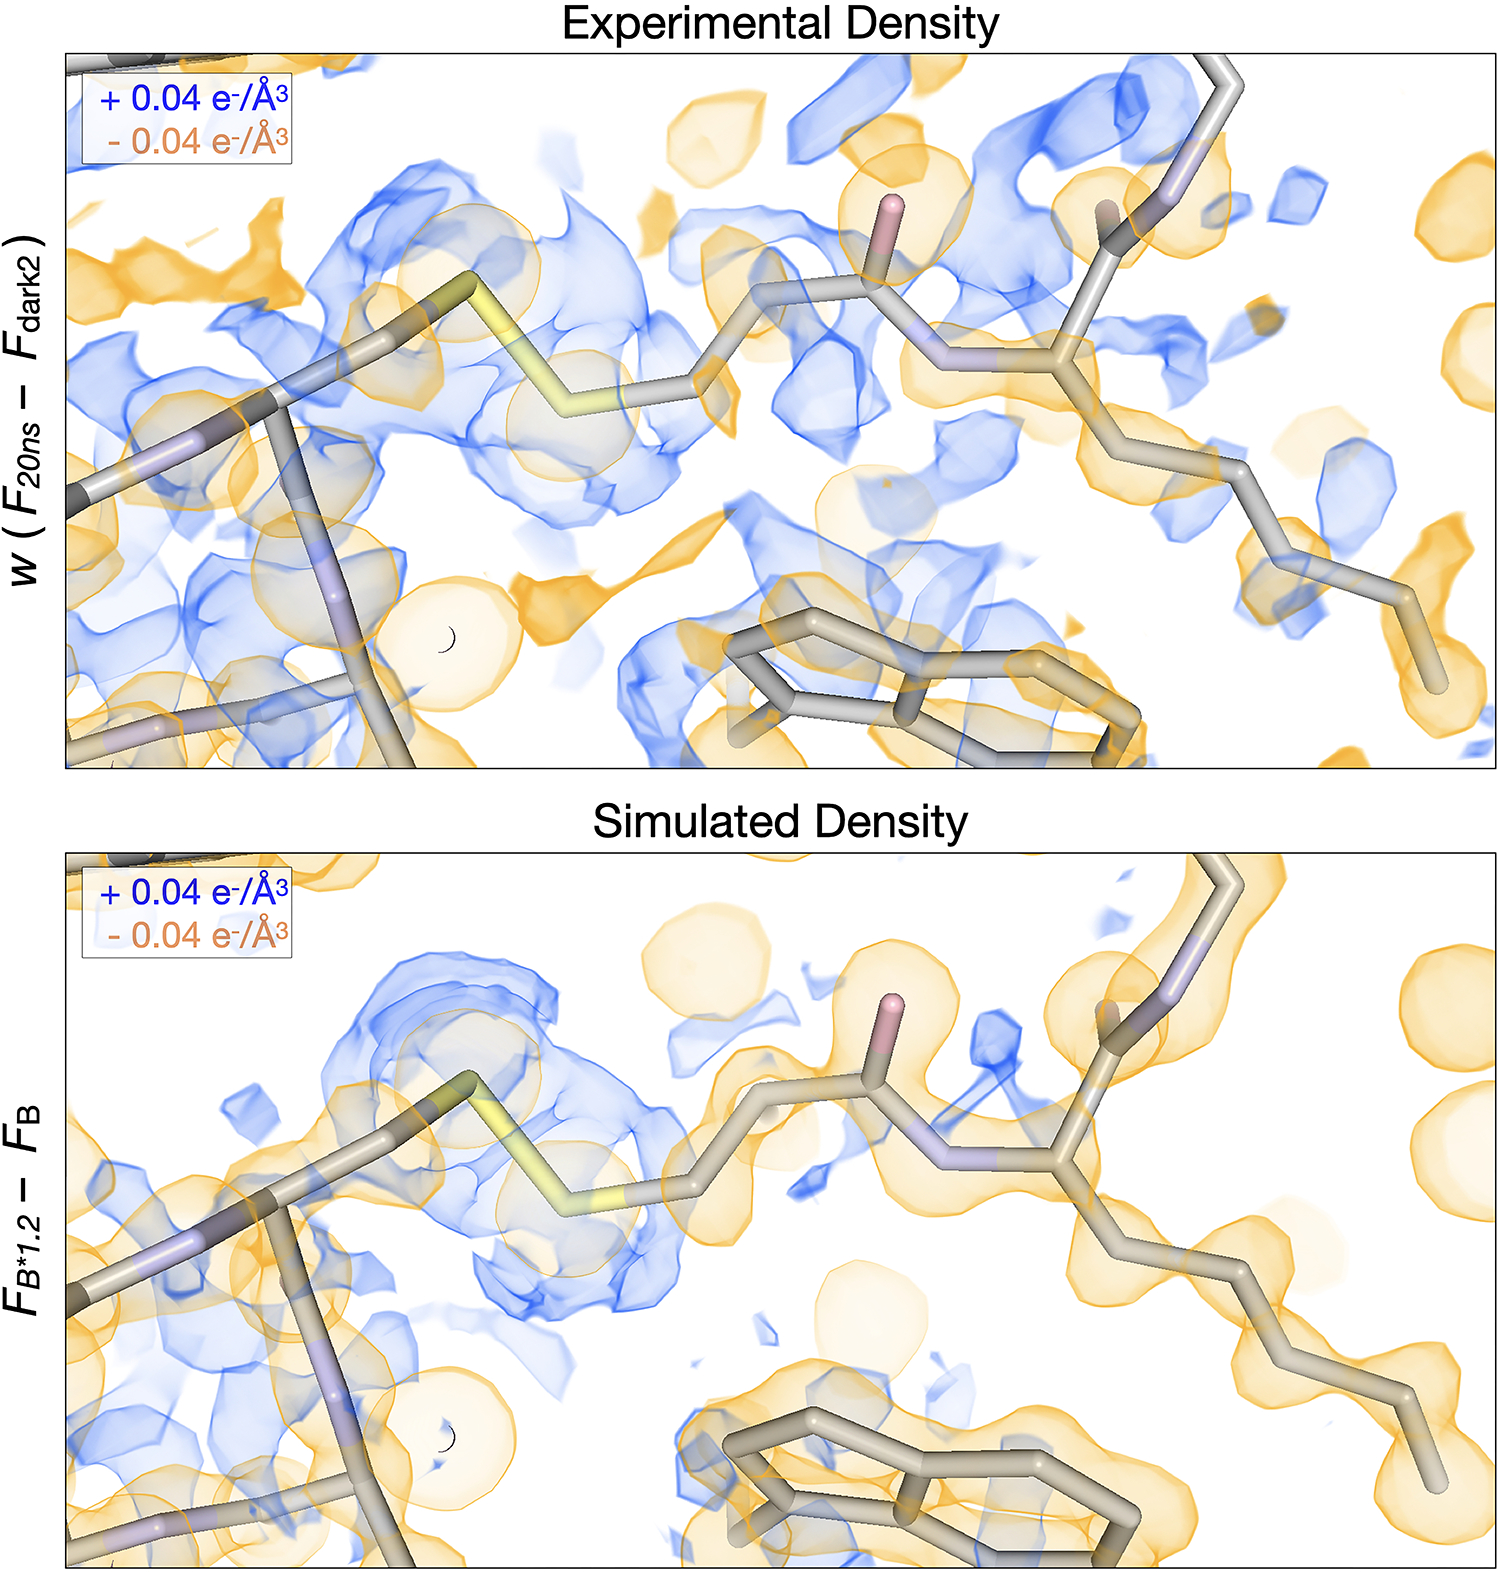
The experimental 20ns difference electron density map is visualized along with a simulated difference density map created by linearly scaling the B-factors in the laser off structure by a factor of 1.2. Negative peaks (yellow) are centered upon atoms in both maps, surrounded by positive features (blue).