
Extended Data Fig. 3. Normal mode analysis of the Apo laser off structure.
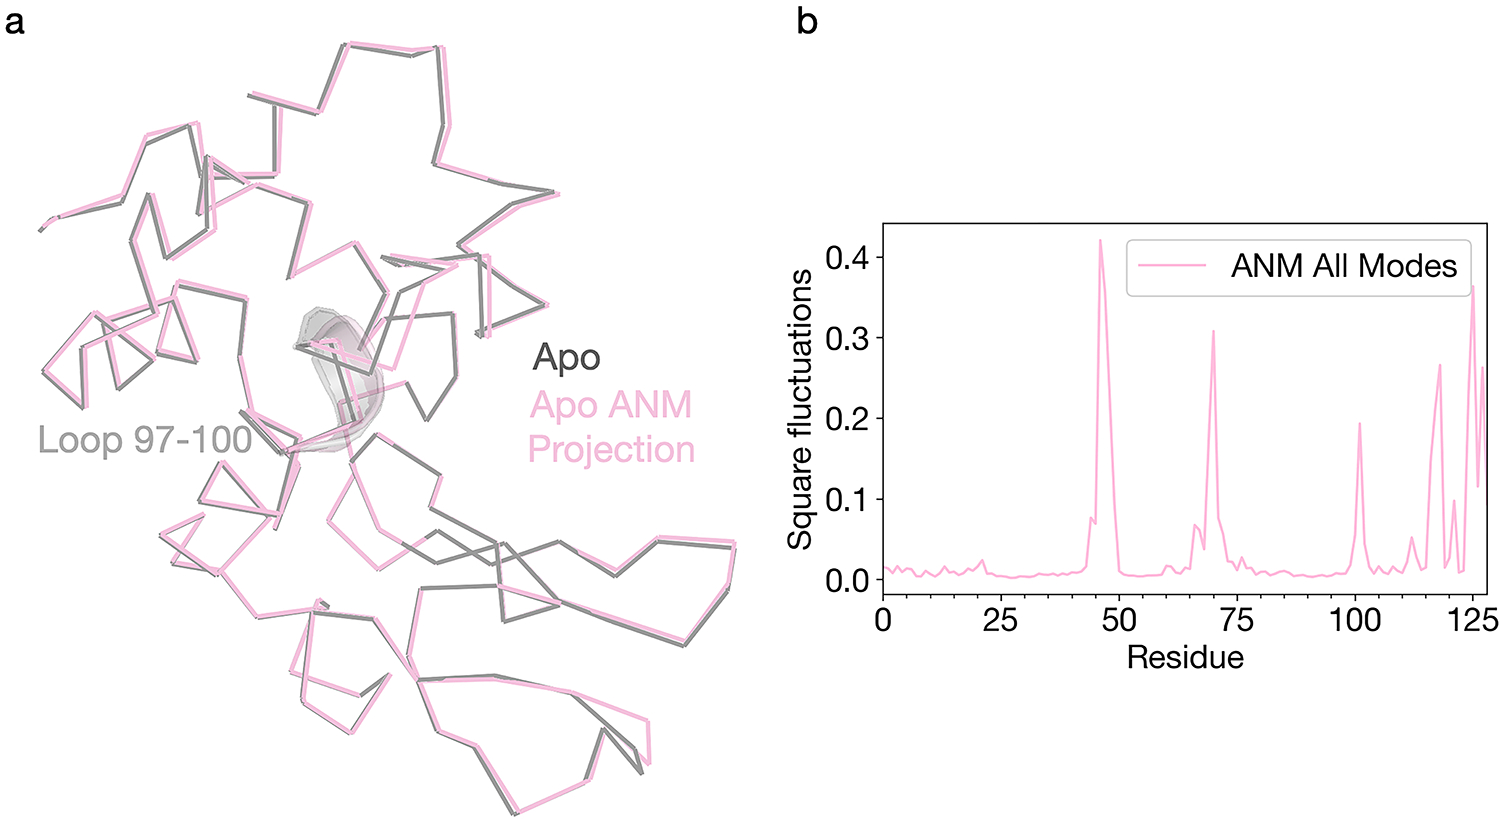
ProDy was used to generate an anisotropic network model based on the apo ground state conformation. (a) The apo structure was then visualized as a ribbon diagram (grey) along with the same model projected along the combined ANM modes (green). (b) Per-residue RMSF values for the ANM model were plotted to quantify local dynamics.