
Fig. 2.
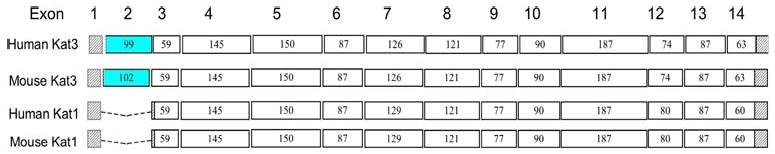
Genomic structure of human KAT I/CCBL1 and KAT III/CCBL2. Schematic representation of the organization of KAT I and KAT III genes. Each box represents an exon and the number of nucleotides with the exon. The shaded regions at N- and C-termini are UTR. The exon 2 is skipped in KAT I isoform a