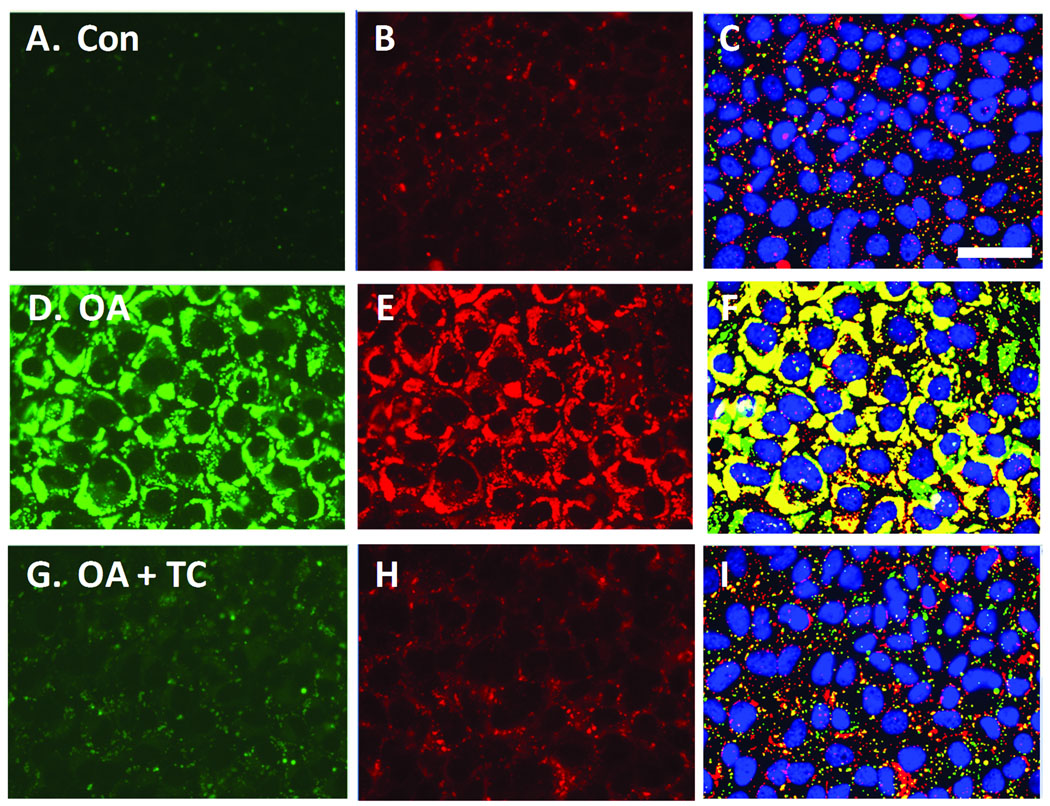
Figure 6. Effects of oleic acid (OA) and triacsin C (TC) on lipid droplet and ADFP expression in AML12 cells.
Cells were cultured in a 96-well plate, then incubated with control media, 200 µM OA or with OA plus 5.4 µM TC, overnight. Cells were fixed, stained for lipid droplets, labeled for ADFP, then imaged (40X) and analyzed in an automated fashion. A, Control cells are shown, visualized for lipid droplets (green). B, The same field of view as A, visualized for ADFP (red). C, The Lipid droplet (green) and Protein masks (red) calculated by CyteSeer® for A and B are shown along with the nuclei (blue). Images D, E, and F, are from a field of view representing cells exposed to OA. G, H, and I are for cells exposed to OA plus 5.4 µM TC. Images A, D, and G were optimized for brightness and contrast in an identical manner, so that faint lipid droplets within A and G could be more easily seen; images B, E, and H were also optimized identically, to increase visualization of ADFP in B and H. In the original images for D and E, pixel intensities were not saturated. Scale bar in A is 50 µm, and applies to all panels.

