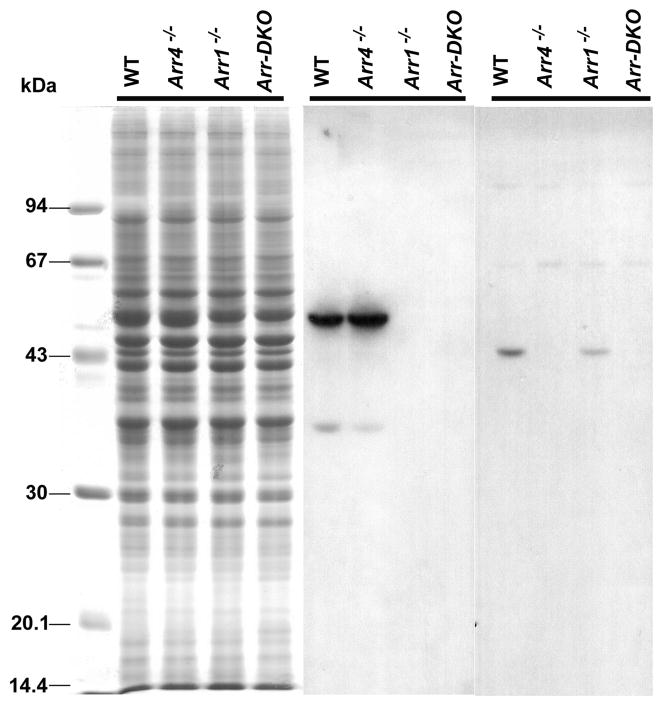
Figure 1.
Immunoblot analysis at P40 of visual arrestin expression in mice retinas from control (WT) and visual arrestin knockouts (Arr1−/−, Arr4−/−, Arr-DKO). Each lane represents ~50 μg retinal proteins from each genotype applied to 11.5% SDS-PAGE and either Coomassie Blue stained (left) or transferred to PVDF membrane and incubated with pAb C10C10 (Arr1) (middle) or pAb mCAR-LUMIj (Arr4) (right), followed by the appropriate HRP-conjugated secondary antibody and processed for ECL. Molecular weight markers (in kDa) are identified on the left.

