
Figure 7:
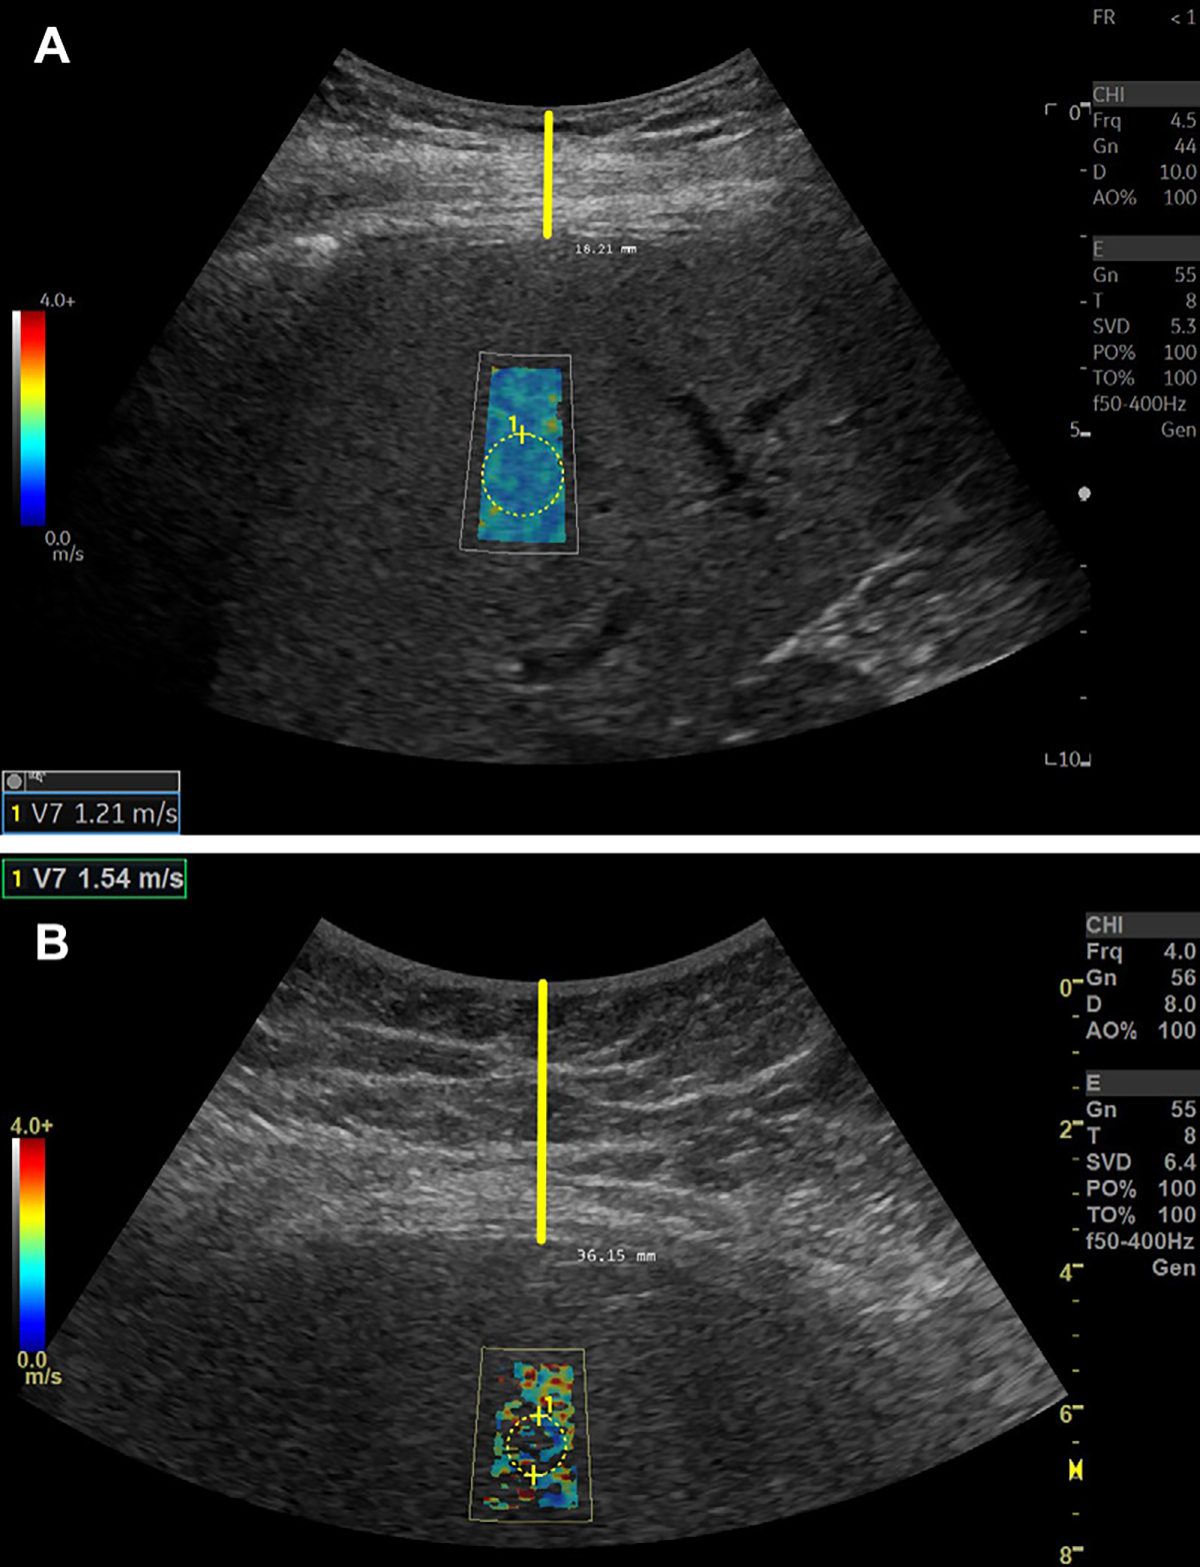
Shear-wave elastography (SWE) signal quality may be affected by the thickness of the subcutaneous tissue or skin-to–liver capsule distance. (A) SWE image in a 74-year-old female patient with clinically suspected nonalcoholic fatty liver disease (NAFLD). SWE examination was performed, and a complete SWE value pixel map was observed. The shear-wave speed, or SWS, color spectrum is presented on the left side (red, high SWS; dark blue, low SWS). Skin-to–liver capsule distance was estimated as 1.8 cm (vertical yellow line). The SWS value is presented in the bottom left corner of the image. SWS values are generated from the circular region of interest. (B) SWE image in a 35-year-old female patient with clinically suspected NAFLD. SWE examination was performed, and poor SWE value pixel map fill-in was observed. Skin-to–liver capsule distance was estimated as 3.6 cm (vertical yellow line). The SWS value is presented in the top left corner of the image. SWS values are generated from the circular region of interest.