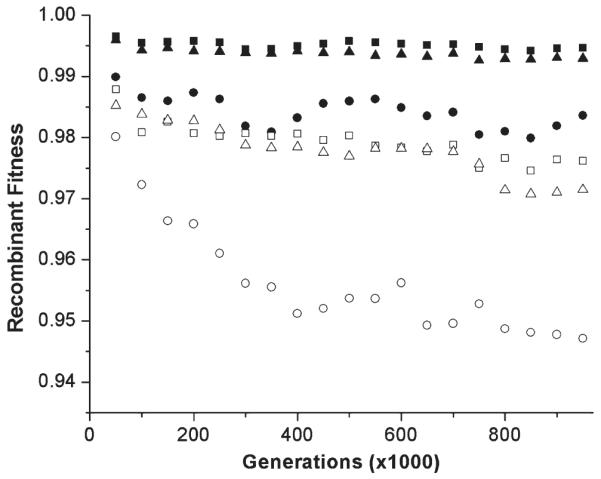
Figure 2.

Average fitness of recombinants between proteins from two diverging populations over the course of evolution. Averages of the same number of high-, medium-, and low-designable structures are represented as in Figure 1, except that the average of the better of the two reciprocal recombinants is shown with a solid symbol, while the average of the worse reciprocal recombinant is shown with a hollow symbol. Populations of size 1,000 were equilibrated for 10,000 generations prior to duplication and divergence for a further one million generations, and sequences were recombined at the midpoint.
