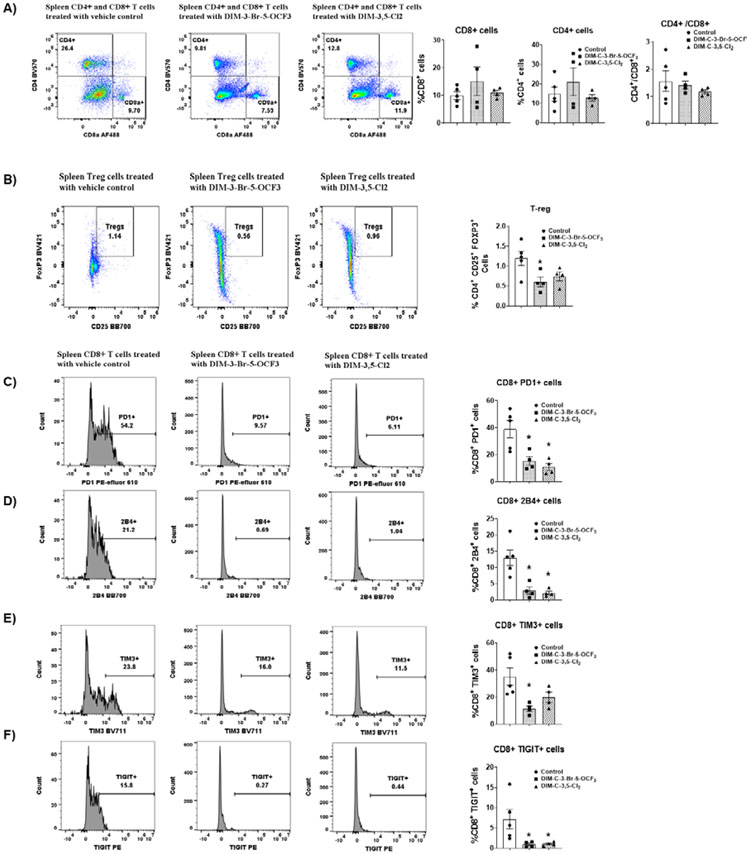
Figure 6.
Analysis of splenic T-cells and markers of exhaustion in splenic CD8+ T-cells. Splenic lymphocytes were isolated and the percentage of CD8+ and CD4+ T-cells (A) and Treg cells (B) were determined by flow cytometric analysis. Flow cytometric analysis using specific antibodies were used to determine the percentage of cells expressing PD1 (C), 2B4 (D), TIGIT (E) and TIM3 (F). Significant (p<0.05) induction or inhibition is indicated (*) and results are expressed as means ± SD for at least 4 separate mice per treatment group. The doses used were 2.5 mg/kg/d for both DIM-3-Br-5-OCF3 and DIM-3,5-Cl2.

