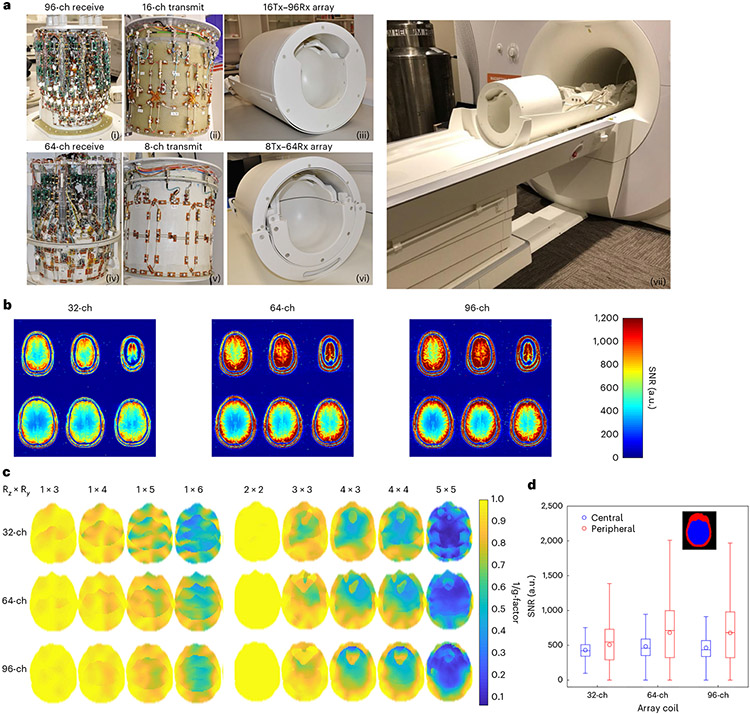
Fig. 2 ∣. High-density receiver array coils and transmit array coils.
a, The top row shows a 16-ch Tx and 96-ch Rx coil: a photograph of the completed 96-ch array (i), the 16-ch dual-row transmit array (ii) and the fully assembled 16-ch Tx, 96-ch Rx coil (iii). The bottom row shows an 8-ch Tx, 64-ch Rx coil: a photograph of the 64-ch receive array (iv), the 8-ch transmit array (v) and the fully assembled 8-ch Tx, 64-ch Rx coil (vi). The scanner’s movable table is specially designed to incorporate the RF array coils (vii). b, Comparison of receiver coil SNR maps between standard 32-ch coil and the 64- and 96-ch coil measured in the same participant. c, Retained SNR (1/g maps) for a range of accelerations (R) on the 64-ch Rx and 96-ch Rx array compared to a standard 32-ch array. d, Boxplots of SNR distributions in a central and peripheral ROI (n = 363,171 and 422,316 voxels, respectively) for each array coil (right panel). Boxes show the median, 25th and 75th percentile values. Circles show mean values. Whiskers show 1.5 times the interquartile range.

