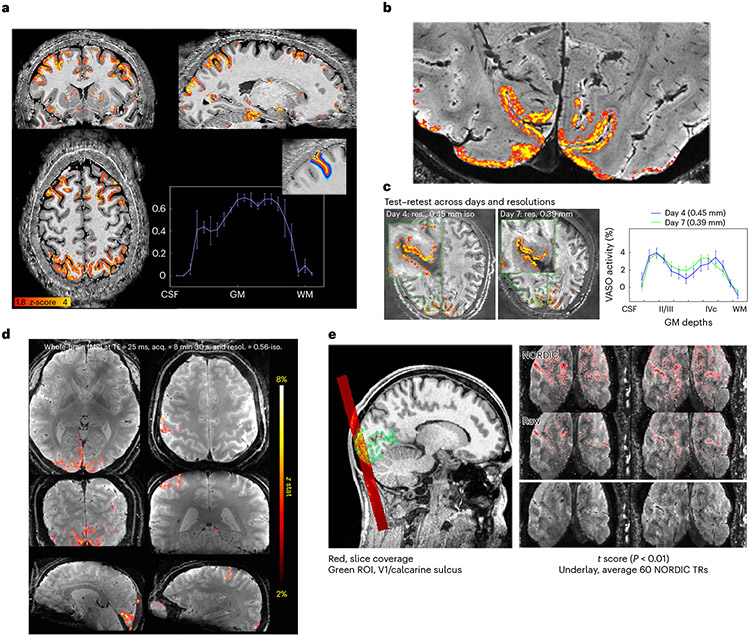
Fig. 4 ∣. VASO and BOLD 3D EPI.
a, Whole-brain VASO layer fMRI acquired at 0.64 mm resolution. A seed-based correlation map from a video watching task after layer-based smoothing displayed on the temporally averaged T1-weighted VASO volume. Activity across the gray matter ribbon (from CSF to white matter (WM)) is plotted with corresponding layer profiles displayed in the inset. Error bars refer to the variance of the signal within each layer across estimated columnar units spanning across approximately 30 mm of cortical ribbon of the sulci depicted in the layer mask. Adapted from ref. 44. b, Layer fMRI combining 0.45 mm and 0.39 mm isotropic resolution data (in 2-mm-thick V1 human cortex) differentiates activation in cortical layers (double stripes of activity) in supra- and infra-granular layers from a flashing checkerboard task. Activations overlaid on high-resolution GRE anatomical image. c, Test–retest of layer fMRI results in V1 across resolutions and days. Error bars defined as for a, across approximately 8 mm of cortical ribbon in the calcarine sulcus. Adapted from ref. 45. d, BOLD fMRI acquired (acq.) with whole-brain coverage at 0.56 mm isotropic (iso.) resolution (resol.) using 3D EPI with random k-space sampling scheme35,36 to increase SNR. e, BOLD fMRI with 3D EPI at ultra-high resolution acquired at 0.35 mm isotropic resolution, imaging visual cortex using stimulation checkerboard for 20 min. Activation maps thresholded at P < 0.01 (one side, no correction for multiple comparisons). NORDIC denoising was applied59. Adapted from ref. 38.

