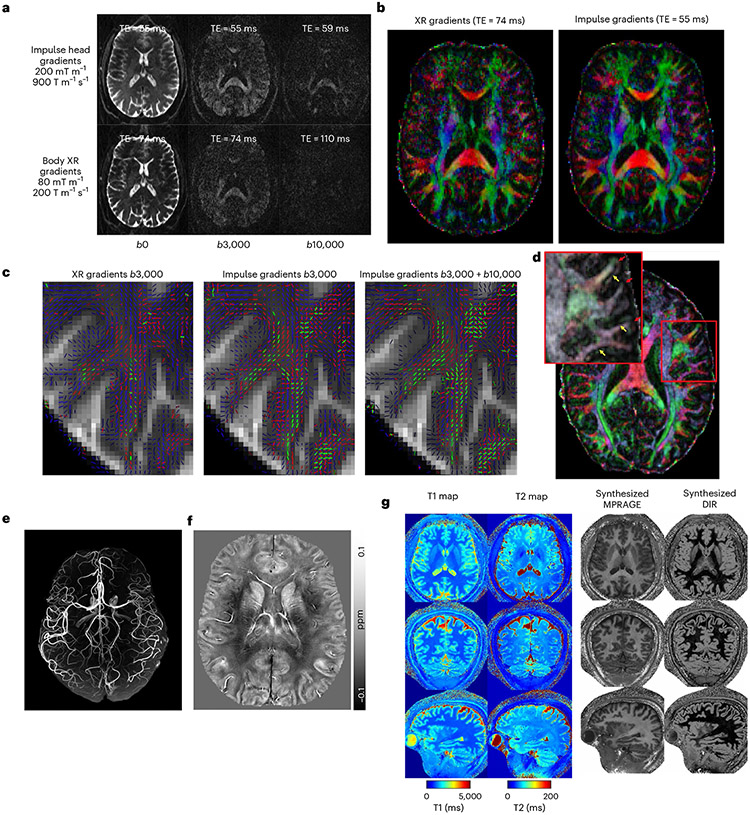
Fig. 5 ∣. Diffusion and structural imaging.
a, Diffusion-weighted MRI at various b values. Comparing images acquired with NexGen 7 T gradient coil performance in the top row to conventional gradient coil performance (80 mT m−1, 200 T m−1 s−1) in the bottom row. b, Improvement in color principal fiber orientation maps with shorter TE and higher SNR using NexGen 7 T gradient coil performance. c, Improvement in crossing fiber detection in complex white matter regions: primary (blue), secondary (red) and tertiary (green) fiber crossings in centrum semiovale white matter. The vector color intensities are modulated by the fiber’s respective volume fraction. Only fibers with volume fractions greater than 5% are shown. d, Pushing the spatial resolution to 0.8 mm using NexGen 7 T gradient coil. The primary diffusion direction map is overlaid onto fractional anisotropy for this 0.8 mm data. Yellow arrows indicate where white matter tracts turn sharply into the cortex and red arrows denote gyral crowns where the white matter tracts continue straight into the gray matter. Adapted from ref. 60. e, Time-of-flight 3D MRA at 0.4 mm isotropic. f, 3D QSM with tenfold acceleration. QSM map of a representative axial slice with a resolution of 0.21 × 0.21 × 1.5 mm3, reconstructed using the software STI Suite (UC Berkeley). g, Whole-brain quantitative mapping and synthesized images using MR fingerprint spiral imaging provided multiple image contrasts at 0.56 mm isotropic in a 4-min acquisition time. From left to right: acquired whole-brain T1 and T2 maps and several derived 3D image sets with different contrasts. MPRAGE (magnetization prepared-rapid GRE), double inversion recovery (DIR).

