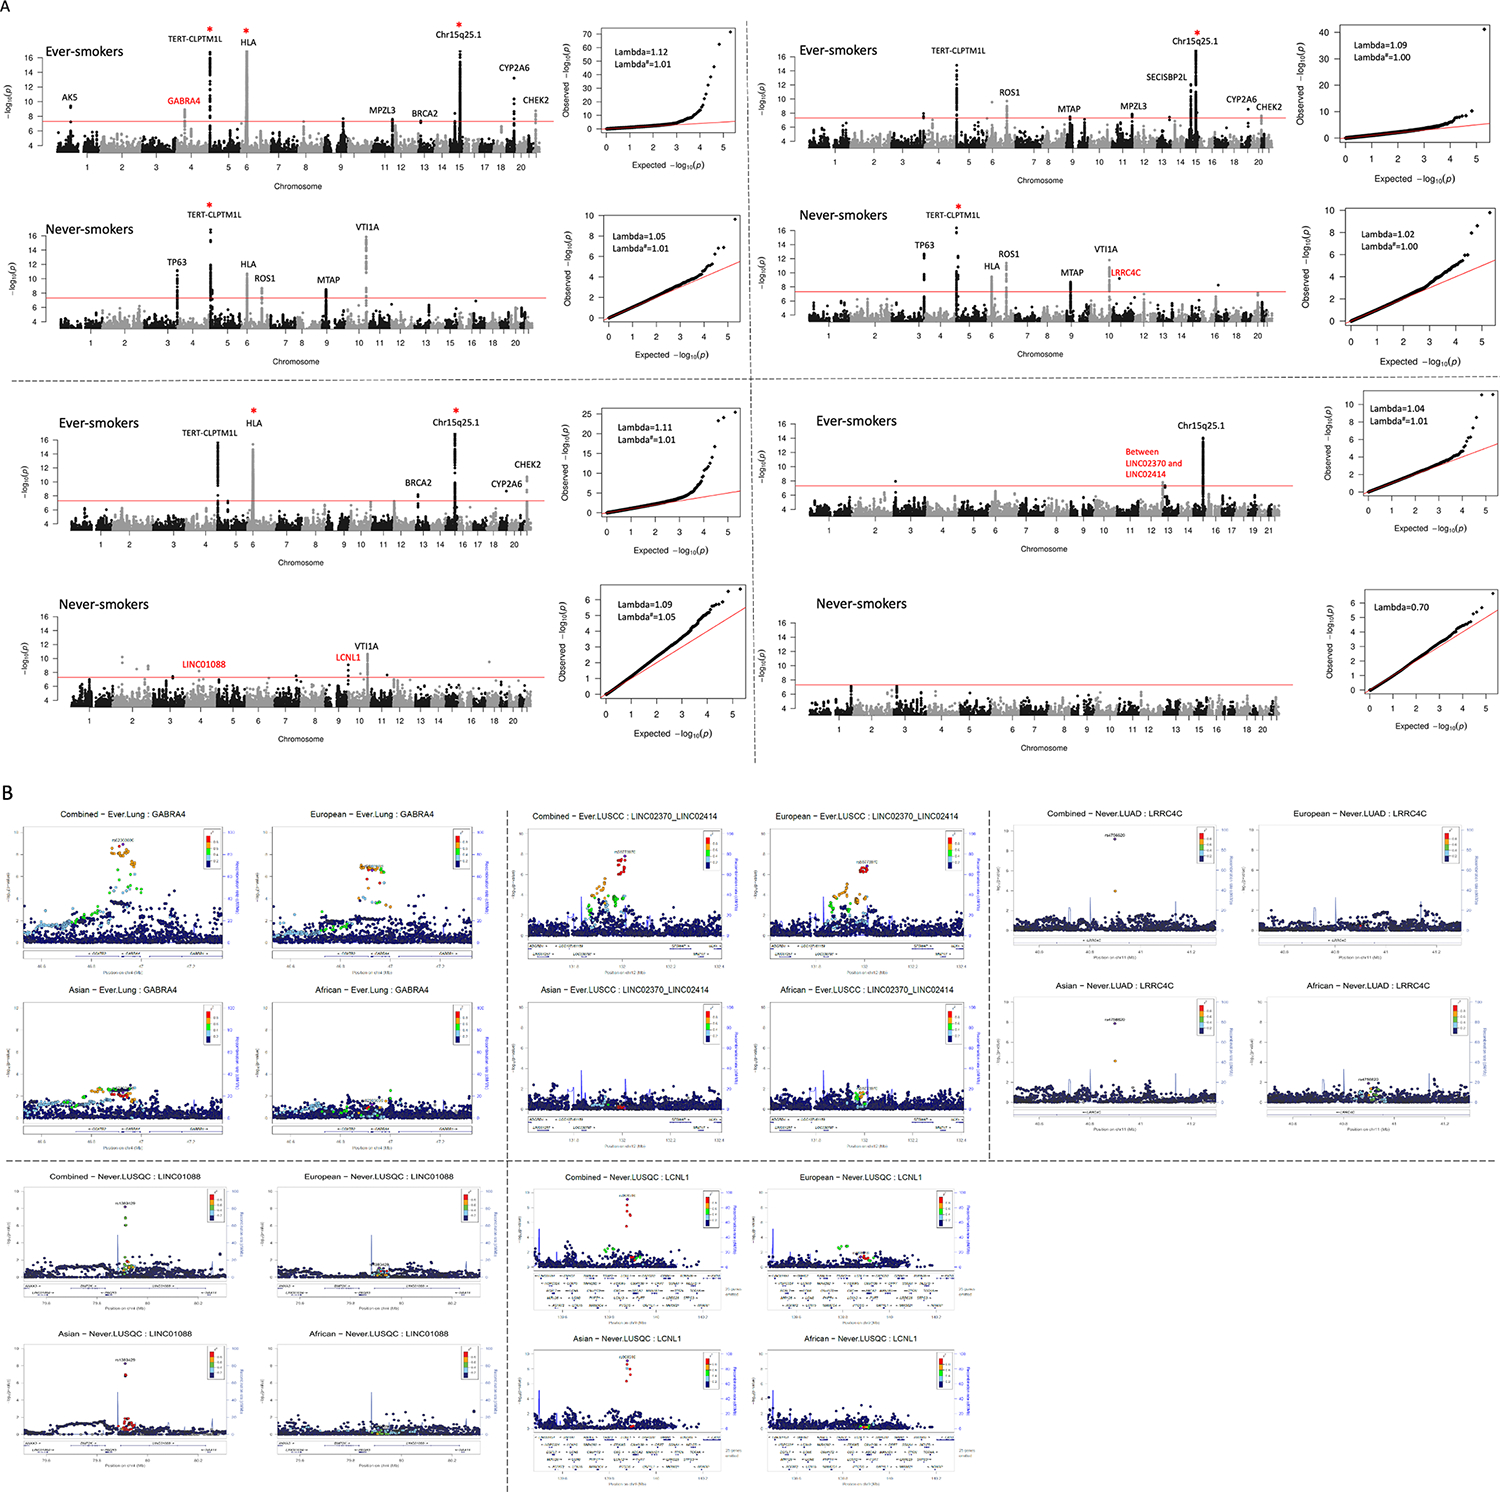
Figure 1.

Signals from genome-wide association analysis in ever- and never-smoking lung cancer. A, Manhattan plot (left) and QQ-plot (right) of signals from the analysis. The y-axis was truncated at 17 in the plots denoted by red *. The known lung cancer variants were labeled in black and novel variants identified in this study were labeled in red. Some variants with joint P values < 5×10⁻⁸ and with association evidence from only one population were not labeled in the plot. X-axis was truncated at 5 in QQ-plots. Lambda value was calculated for each analysis. Both normal lambda and lambda adjusted by sample size (indicated by #) were calculated for each stratum except for never-smoking small-cell lung cancer where the number of cases was < 1000. No inflated type I error rate was detected. B, regional plots of signals identified in each population and meta-analysis. The color intensity reflected the extent of linkage disequilibrium index (r2) with the target SNP denoted in purple.
