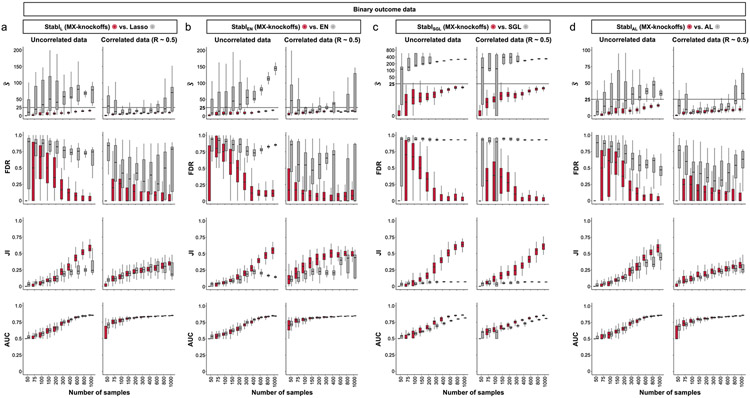
Extended Data Fig. 9 ∣. Stabl’s performance on synthetic data with binary outcomes.
Synthetic datasets with binary outcome variables were generated as described in Fig. 3. Sparsity (), reliability (FDR and JI), and predictivity (RMSE) performances of StablSRM (red box plots) compared to the respective SRM (grey box plots) as a function of the sample size (n, x-axis) for StablL (a), StablEN (b), StablSGL (c), and StablAL (d). Scenarios with 25 informative features and uncorrelated (left panels) or intermediate feature correlation structures (Spearman R ~ 0.5, right panels) are shown. Boxes in box plots indicate the median and interquartile range (IQR), with whiskers indicating 1.5 × IQR.

