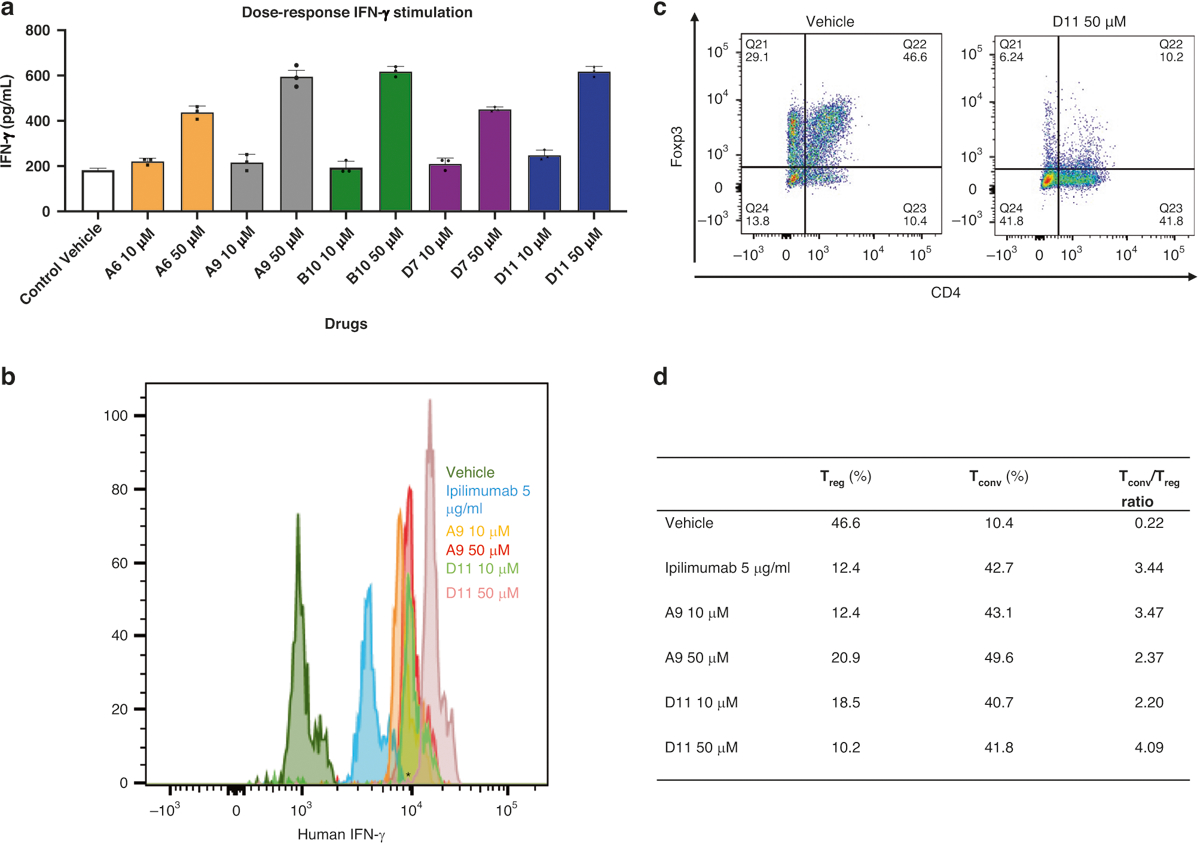
Fig. 2. IFN-ϒ production in T cells and T conventional /T regulatory cells treated with CTLA-4 inhibitors.

a Mouse IFN-ϒ. Tumor-infiltrating lymphocytes from C57BL/6 mice and MC38 cells were cocultured with the top 5 compounds at 2 doses (10 μM, 50 μM). The IFN- ϒ value was measured with AlphaLISA. b Human IFN-ϒ stimulation. Dendritic cells and allogenic T-cells from human peripheral blood mononuclear cells were cocultured with the compounds at 2 doses (10 μM and 50 μM), and IFN-ϒ–positive cells were detected with flow cytometry. c The TConv:Treg ratio in representative populations. The TConv:Treg ratio was also determined with flow cytometry. d TConv and Treg individual percentages and ratios. The table summarizes the percentages of Tconv and Treg cells in cocultured dendritic cells and peripheral blood mononuclear cells treated with A9 and D11 (10 μM and 50 μM) compared to controls (n = 3). AlphaLISA amplified luminescent proximity homogeneous LISA, CTLA-4 cytotoxic T-lymphocyte–associated protein 4, Foxp3 forkhead box p3, IFN-γ interferon γ, Tconv T conventional, Treg, T regulatory.
