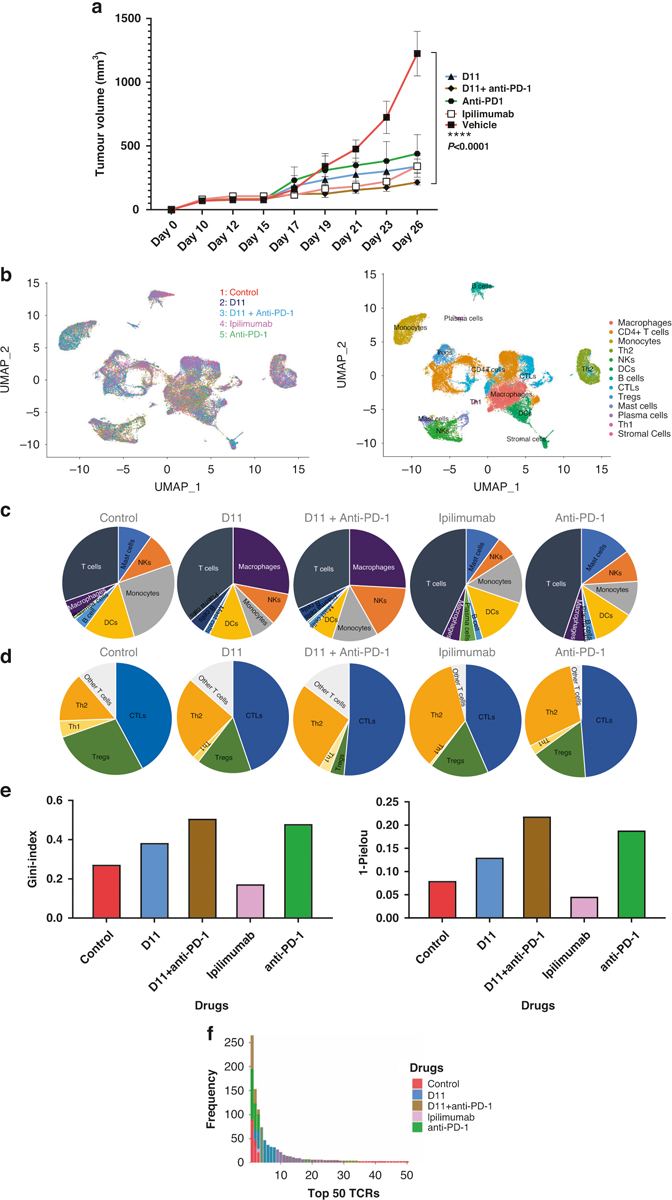
Fig. 5. Single-cell sequencing.

a Tumor inhibition in mice. D11, ipilimumab, anti-PD-1, and D11 plus anti-PD-1 inhibited tumors in established syngeneic mouse models expressing transgenic humanized CTLA-4 protein. Treatments (n = 5 for D11, n = 4 for anti-PD-1, n = 5 for D11 plus anti-PD-1, n = 5 for ipilimumab, and n = 4 for the phosphate-buffered saline vehicle) were started after the tumors were established, and the tumor volumes reached approximately 100 mm3. b Single-cell RNA sequencing integration and clustering. The data from the 5 different treatment groups were integrated using Seurat (V.4.0.3) in R to account for the batch effect for the downstream analyses. Thirteen immune-related clusters were identified. c, d Different immune and T-cell population numbers are presented in the charts for each treatment group. e Uneven distribution of T-cell receptors (TCRs) in therapies. D11, anti-PD-1, and the combination of these 2 treatments increased the uneven distribution of TCRs. Ipilimumab decreased the clonality of the TCR repertoire, whereas the other 3 treatments increased it. f The frequency of the top 50 TCRs increased with the use of D11 plus anti-PD-1. CTL cytotoxic T cell, CTLA-4 cytotoxic T-lymphocyte–associated protein 4, DC dendritic cell, NK natural killer, PD-1 programmed cell death protein-1, PD-L1 programmed death-ligand 1, and Treg T regulatory cell.
