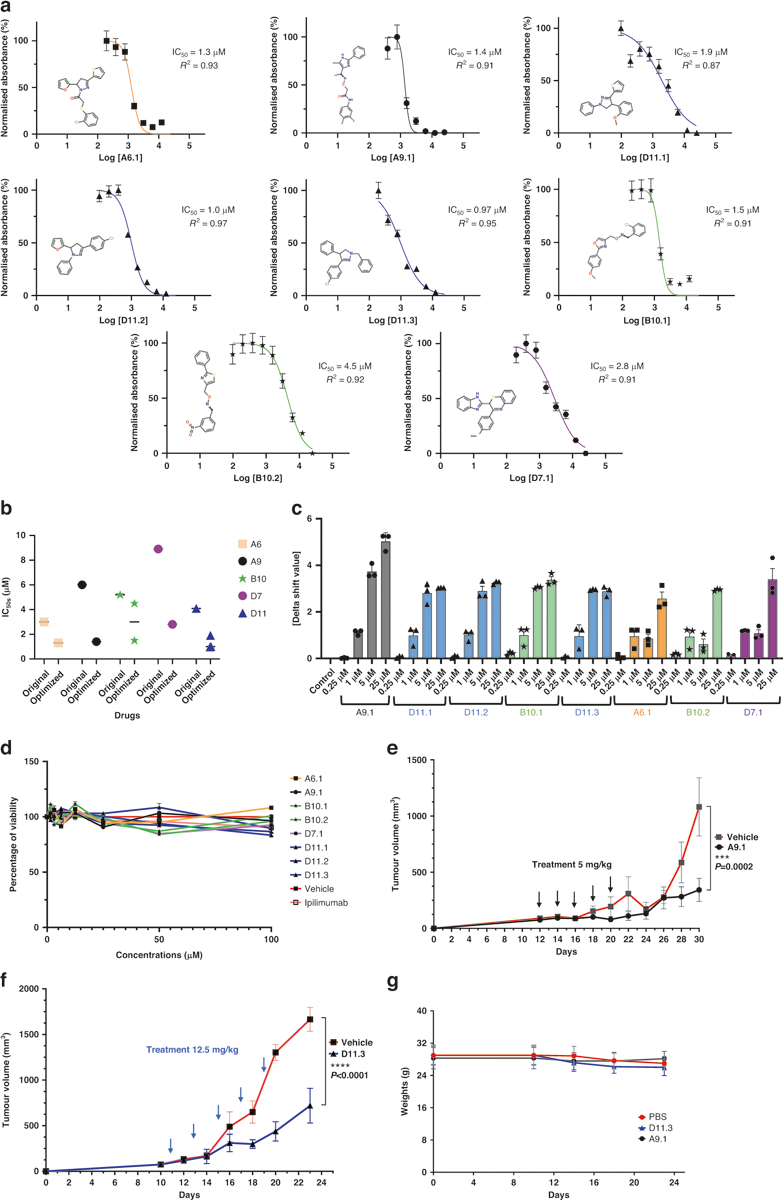
Fig. 6. Optimization of CTLA-4-targeting compounds.

a AlphaLISA. IC50 values were measured as the reduction in 615 nm luminescence (color-coded panels: the optimized lead compounds were A6.1, A9.1, D11.1, D11.2, D11.3, B10.1, B10.2, and D7.1). b IC50 comparison between optimized and parental compounds. c PTS. Optimized dose-response results (0.25 μM, 1 μM, 5 μM, and 25 μM) are illustrated. d In vitro cell viability assay. The compounds did not affect MC38 viability directly. MC38 cells were treated with compounds for 48 h. The highest concentration for ipilimumab was 3 μg/ml (n = 4). e A9.1 inhibited tumors in established syngeneic mouse models expressing transgenic humanized CTLA-4 protein. Treatments (n = 11 for A9.1, n = 10 for the phosphate-buffered saline vehicle) were started after the tumors were established and the tumor volumes reached approximately 100 mm3. f D11.3 inhibited tumors in established syngeneic mouse models expressing transgenic humanized CTLA-4 protein. Treatments (n = 5 for D11.3, n = 5 for the vehicle) were started after the tumors were established, and the tumor volumes reached approximately 100 mm3. g The respective treatments did not lead to significant weight loss in the mice. Error bars represent the standard error of the mean. AlphaLISA amplified luminescent proximity homogeneous LISA, CTLA-4 cytotoxic T-lymphocyte–associated protein 4, IC50 half-maximal inhibitory concentration, PTS protein thermal shift.
