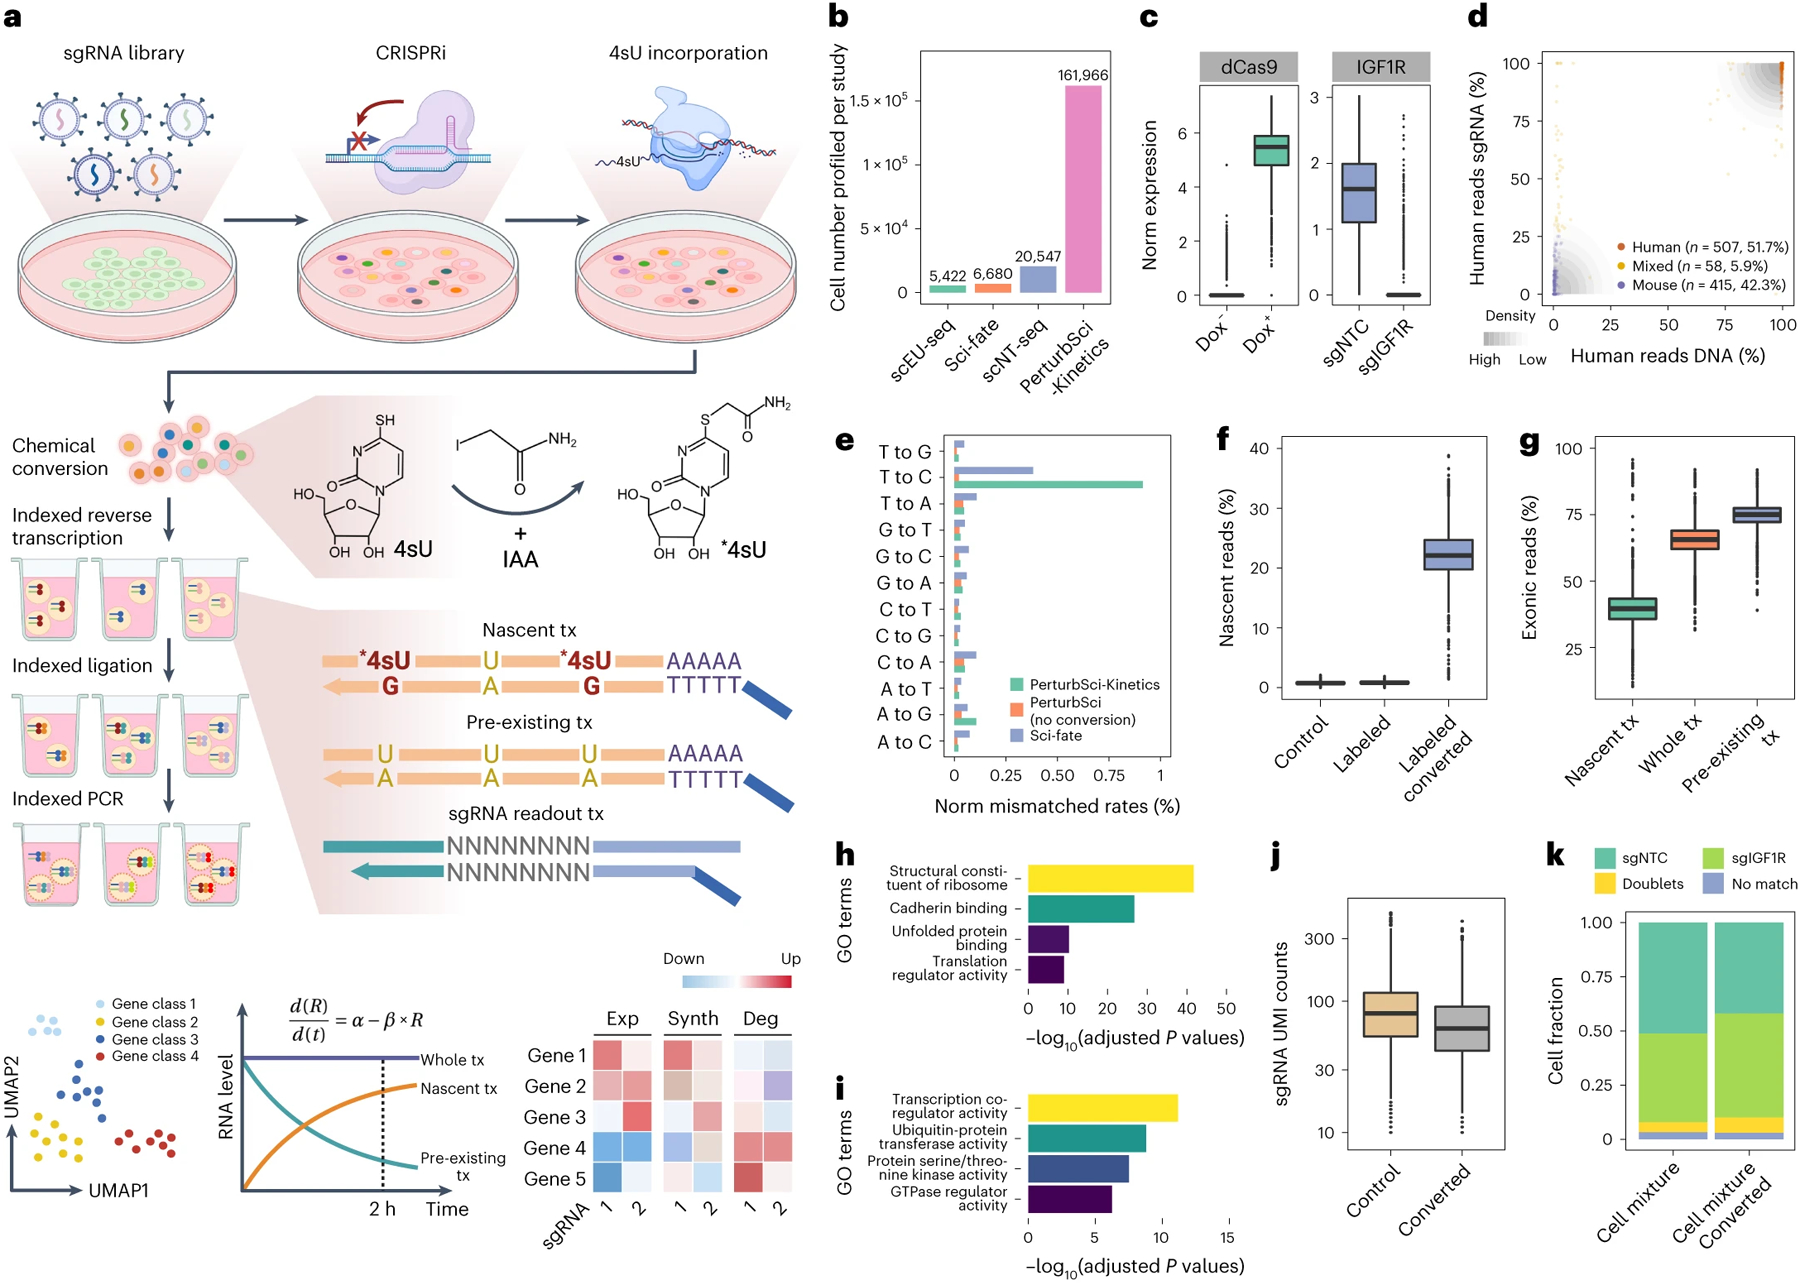
Figure 1. PerturbSci-Kinetics enables joint profiling of transcriptome dynamics and high-throughput gene perturbations.

a. Scheme of PerturbSci-Kinetics. IAA, iodoacetamide. *4sU, chemically modified 4sU. R and Exp, steady-state expression. α and Synth, RNA synthesis rate. β and Deg, RNA degradation rate. b. Barplot showing the cell numbers profiled in this study and those from published single-cell RNA-seq coupled with metabolic labeling20–22. c. Left: the log-transformed normalized expression of dCas9-KRAB-MeCP2 in untreated (n = 3,344 cells) or Dox-induced HEK293-idCas9 cells (n = 1,419 cells). Right: the normalized expression of IGF1R in Dox-induced HEK293-idCas9 cells transduced with sgNTC (n = 688 cells) or sgIGF1R (n = 820 cells). d. An equal number of induced HEK293-idCas9-sgIGF1R cells and 3T3-CRISPRi-sgFto cells were mixed and were profiled using PerturbSci. Scatterplot showed the concordance between percentage of transcriptome and sgRNA reads mapping to human and mouse genomes and human and mouse sgRNA, respectively, for each cell. e. Barplot showing the sequencing-depth-normalized percentages of single-base mismatches in reads from sci-fate20, and PerturbSci-Kinetics on chemically converted or unconverted cells. f. Boxplot showing the fraction of nascent reads recovered from single cells without 4sU labeling and chemical conversion (n = 1,498 cells), 4sU-labeled cells without chemical conversion (n = 1,008 cells), and 4sU-labeled/converted cells (n = 2,568 cells). g. Boxplot showing the proportion of nascent, pre-existing, and whole-transcriptome reads mapped to exons of the genome across single cells (n=4,115 cells). h-i. Barplots showing the enriched Gene Ontology (GO) terms in genes with low (h) or high (i) nascent reads fractions. One-sided Fisher’s Exact Tests were conducted with the alternative hypothesis that the true odds ratio is greater than 1. j. Boxplot showing the sgRNA UMI counts/cell in cells with (n = 2,568 cells) or without the chemical conversion (n = 2,506 cells). k. Stacked barplot showing the fraction of converted/unconverted cells identified as sgNTC/sgIGF1R singlets, doublets, and cells with no sgRNA detected. Boxes in boxplots indicate the median and interquartile range (IQR) with whiskers indicating 1.5× IQR.
