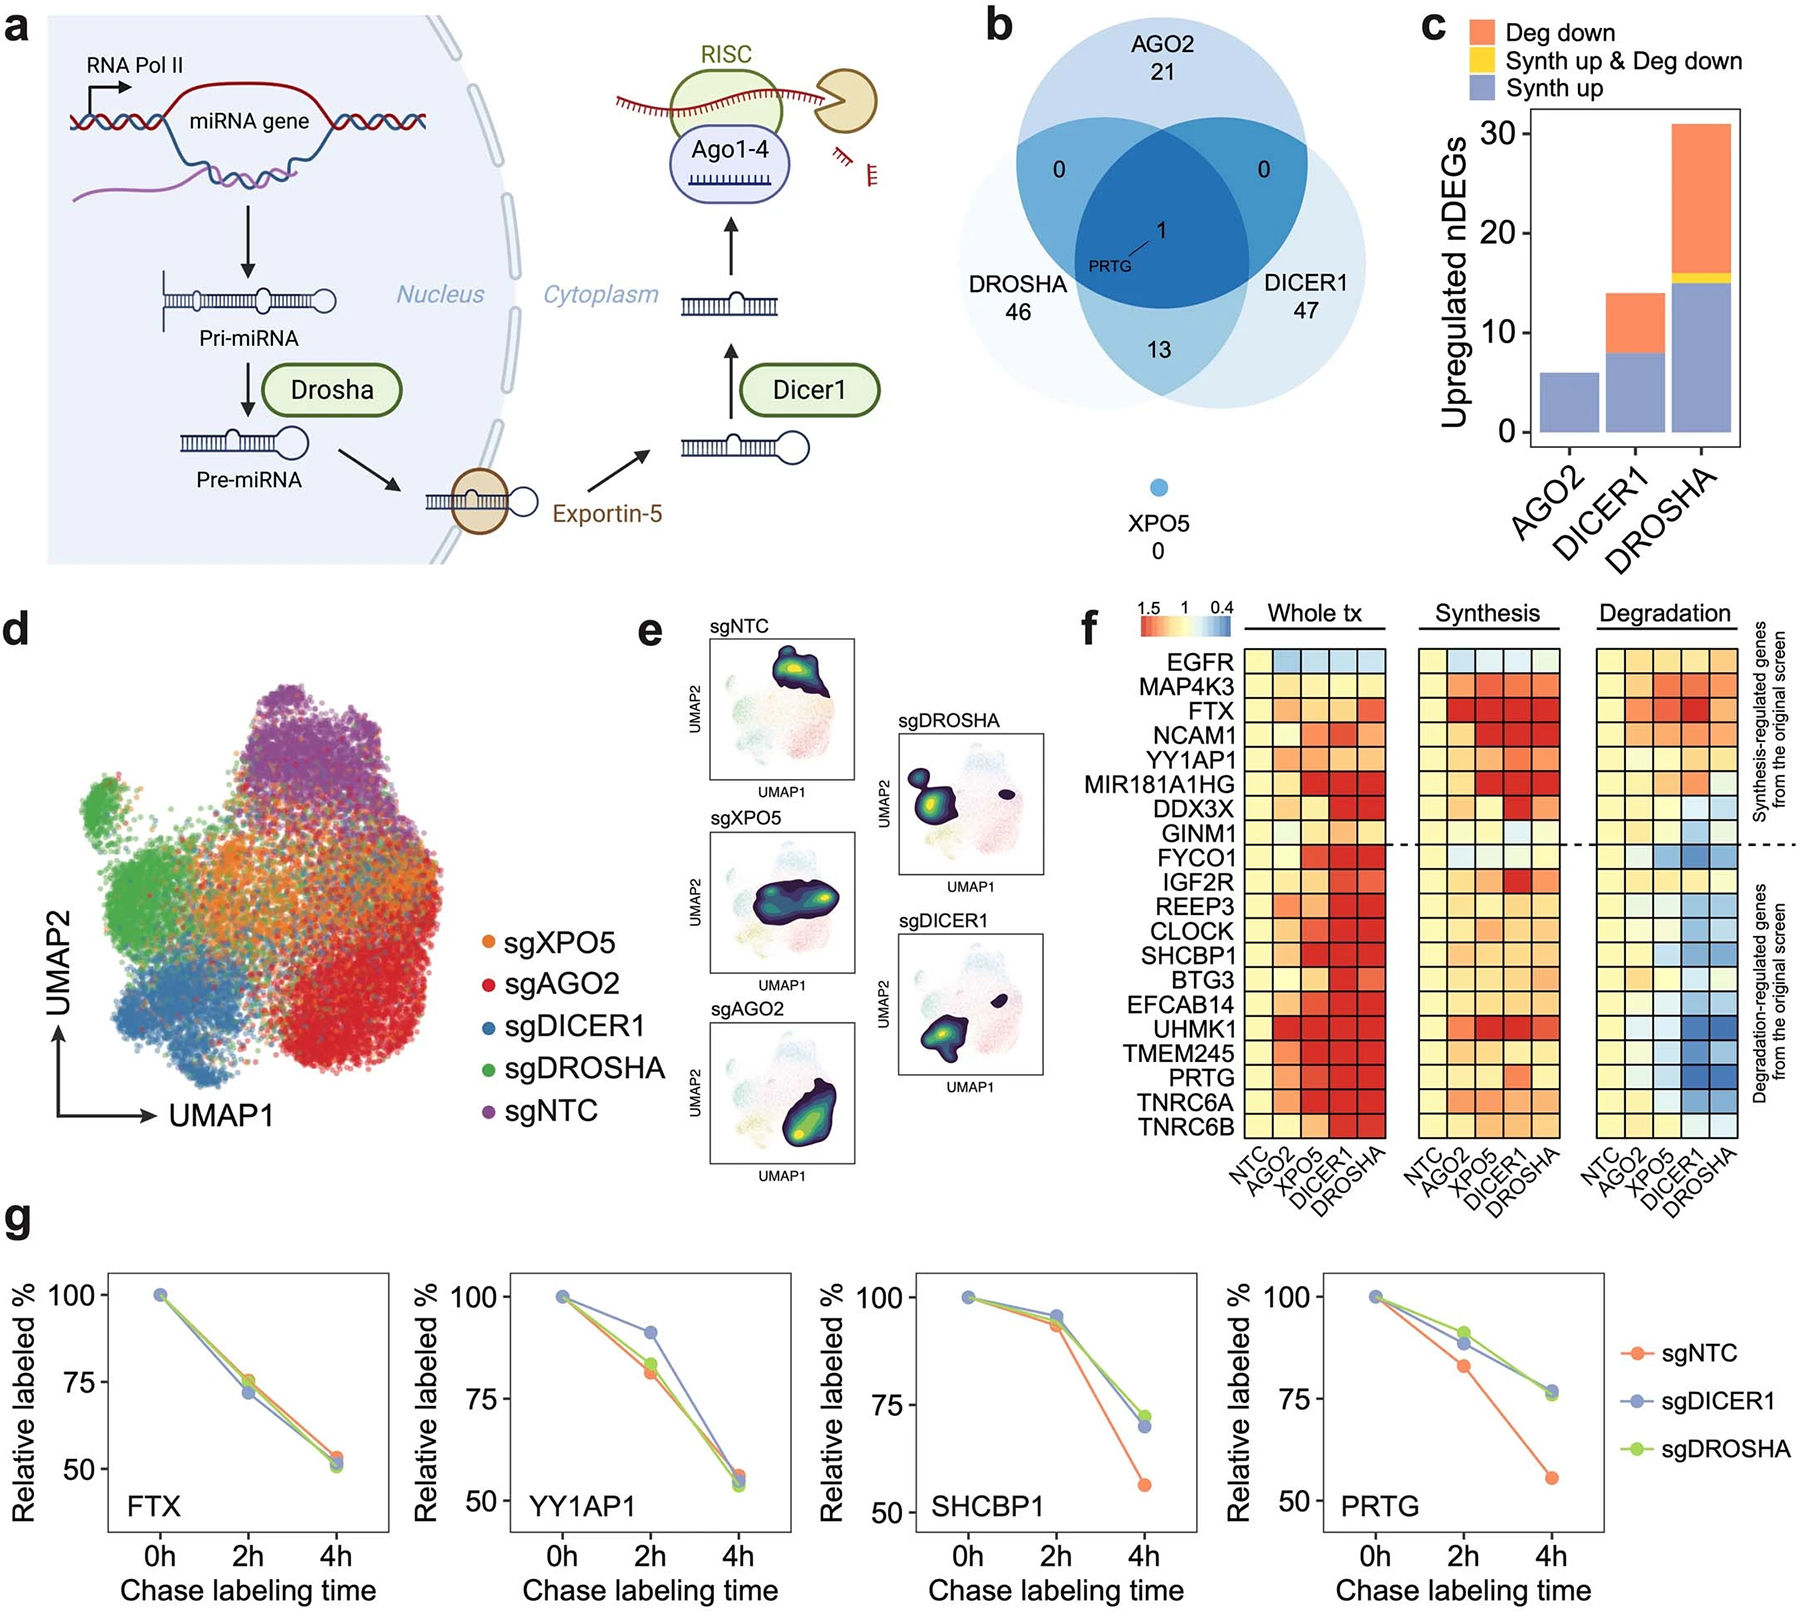
Extended Data Fig. 9.

a. Illustration of the canonical miRNA biogenesis pathway. After the transcription of miRNA host genes, the primary miRNA (pri-miRNA) forms into a hairpin and is processed by DROSHA. Processed precursor miRNA (pre-miRNA) is transported to the cytoplasm by Exportin-5. The stem loop is cleaved by DICER1, and one strand of the double-stranded short RNA is selected and loaded into the RISC for targeting mRNA35. b. Venn diagram showing the overlap of upregulated DEGs across perturbations on four genes encoding main members of the miRNA pathway. The knockdown of DROSHA and DICER1 in this pathway resulted in significantly overlapped DEGs (p-value = 2.2e-16, one-sided Fisher’s exact test). In contrast, AGO2 knockdown resulted in more unique transcriptome features. XPO5 knockdown showed no upregulated DEGs, consistent with a previous report in which XPO5 silencing minimally perturbed the miRNA biogenesis36. c. Bar plot showing the fraction of upregulated DEGs driven by synthesis/degradation changes upon DROSHA, DICER1, and AGO2 perturbations. While DROSHA and DICER1 knockdown resulted in increased synthesis and reduced degradation, AGO2 knockdown only affected gene expression transcriptionally, consistent with our finding that AGO2 knockdown resulted in a global increase of synthesis rates (Fig 2e), and further supported its roles in nuclear transcription regulation65–67. As DROSHA is upstream of DICER1 in the pathway, we observed stronger effects of DROSHA knockdown than DICER1 knockdown, which was supported by the previous study36. d-e. UMAP of sgNTC cells and single cells with individual miRNA biogenesis pathway genes knockdown. f. Reproducible steady-state expression, synthesis rate, and degradation rate changes of synthesis/degradation-regulated genes in the validation dataset. g. Example genes showing unchanged (transcription-regulated genes: FTX, YY1AP1) and enhanced (degradation-regulated genes: SHCBP1, PRTG)
