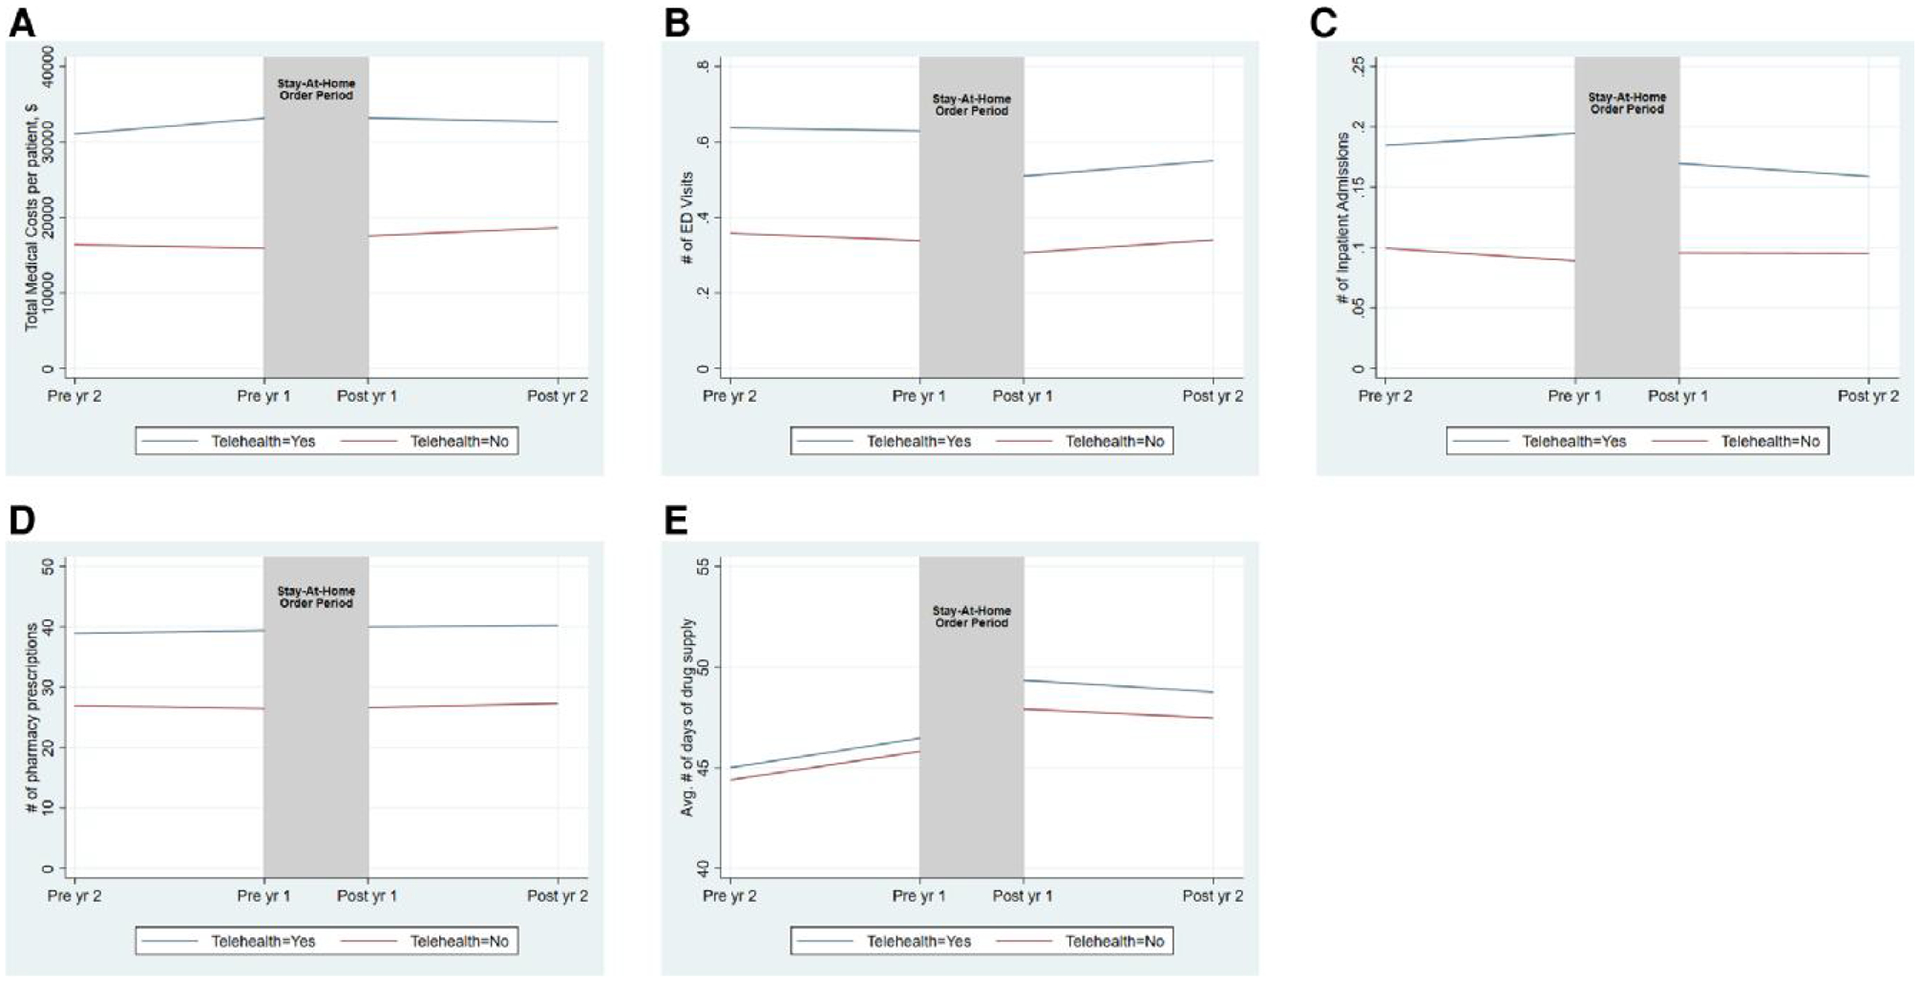
Figure 1.

Trends in medical costs and health care utilization among telehealth users and nonusers before and after the stay-at-home order period (unadjusted). (A) Total medical costs. (B) Number of ED visits. (C) Number of inpatient admissions. (D) Number of pharmacy prescriptions. (E) Average number of days of drug supply. The vertical shaded area indicates telehealth use during the stay-at-home order periods (March–June 2020). We provided pre– and post–stay-at-home order trends of the outcomes among individuals who used and did not use telehealth during the stay-at-home order periods. Pre and Post indicate pre– and post–stay-at-home order periods. All estimates are per patient per year. The corresponding estimates are available in Appendix Table S4. Abbreviations: Avg, average; ED, emergency department; yr, year.
