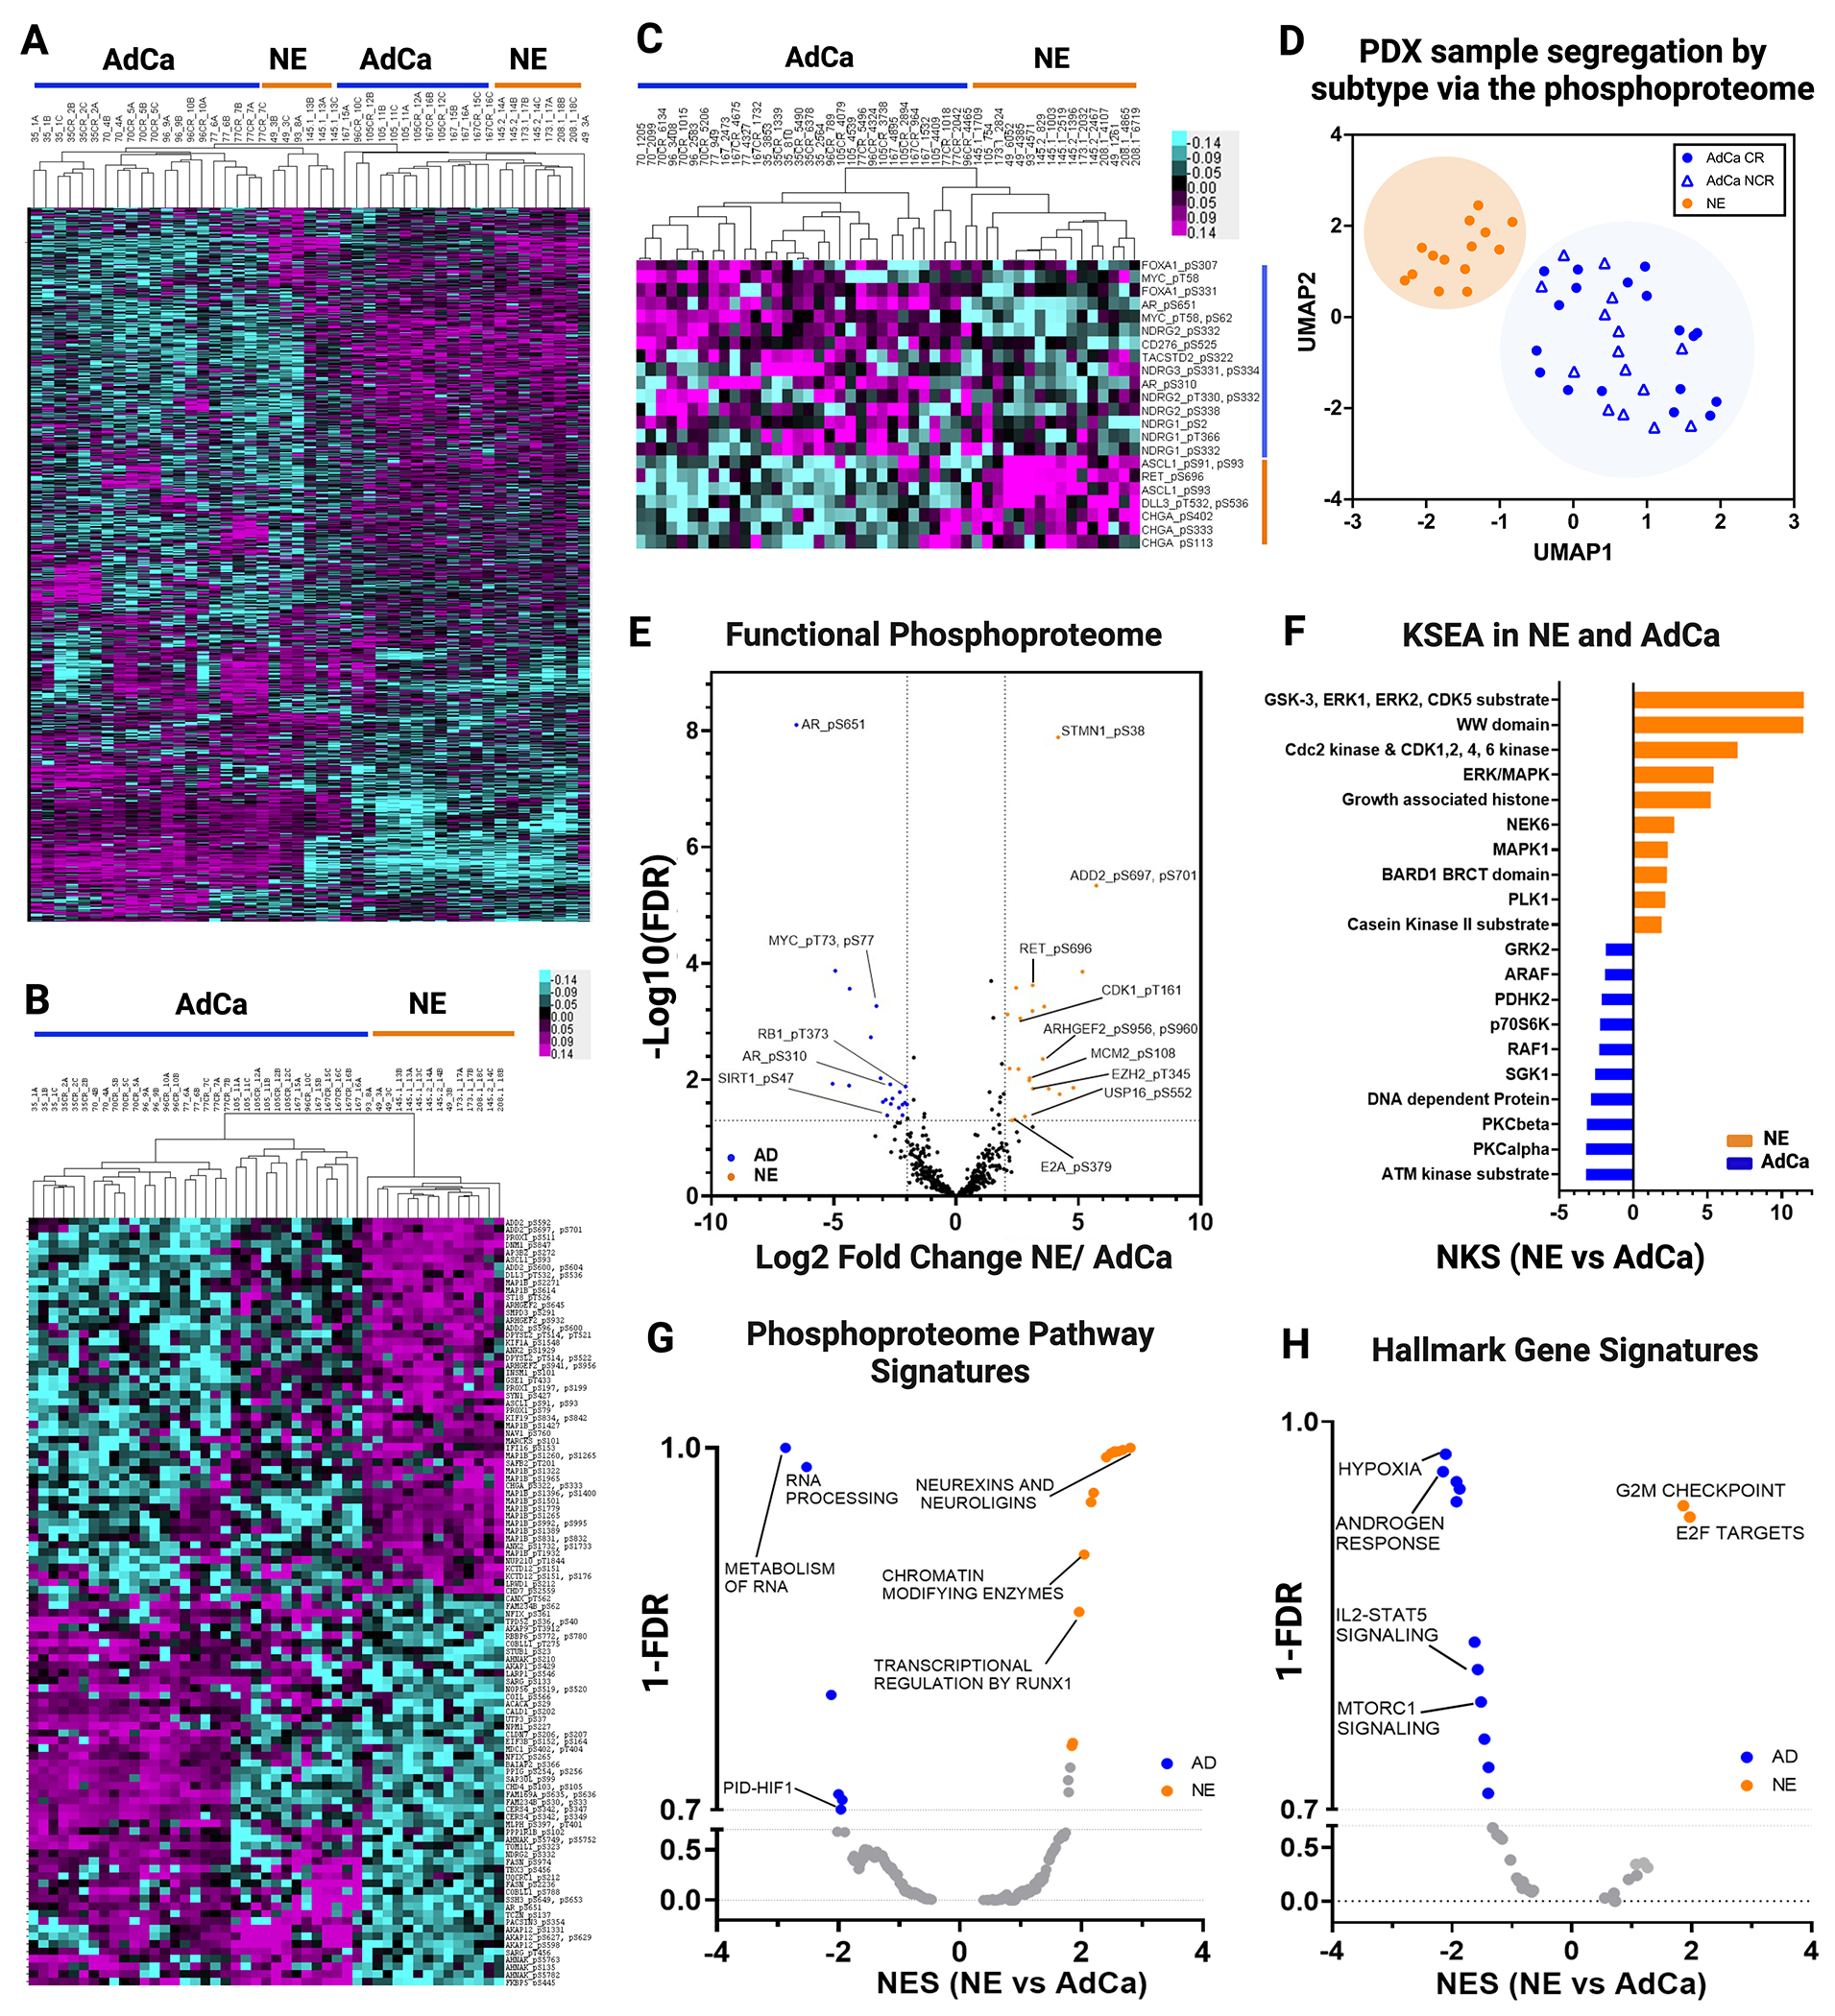
Figure 3. Phosphoproteome Landscape of PDXs in Prostate Cancer.

A. Data driven unsupervised clustering of 9,723 phosphopeptides with 1% FDR. B. Unsupervised clustering of TOP 50 NE and 50 AdCA hyper-phosphorylated peptides. C. Unsupervised hierarchical clustering signature protein-phospho-counterpart. D. UMAP analysis of all phosphopeptides. E. Functional phosphoproteome of NE and AD hyperphosphorylated peptides. F. Kinase/substrate enrichment (KSEA) analysis identified unique and known kinases that were predicted from the phosphoproteome (Top 10 hits are showed on each group). G-H. Gene set enrichment analysis (GSEA) was performed to identify canonical pathways (F) and hallmarks in cancer (G) enriched in NE (orange) and in AdCa (blue). NES, normalized enrichment score; orange, hyperphosphorylated in NE and blue hyperphosphorylated in AdCa.
