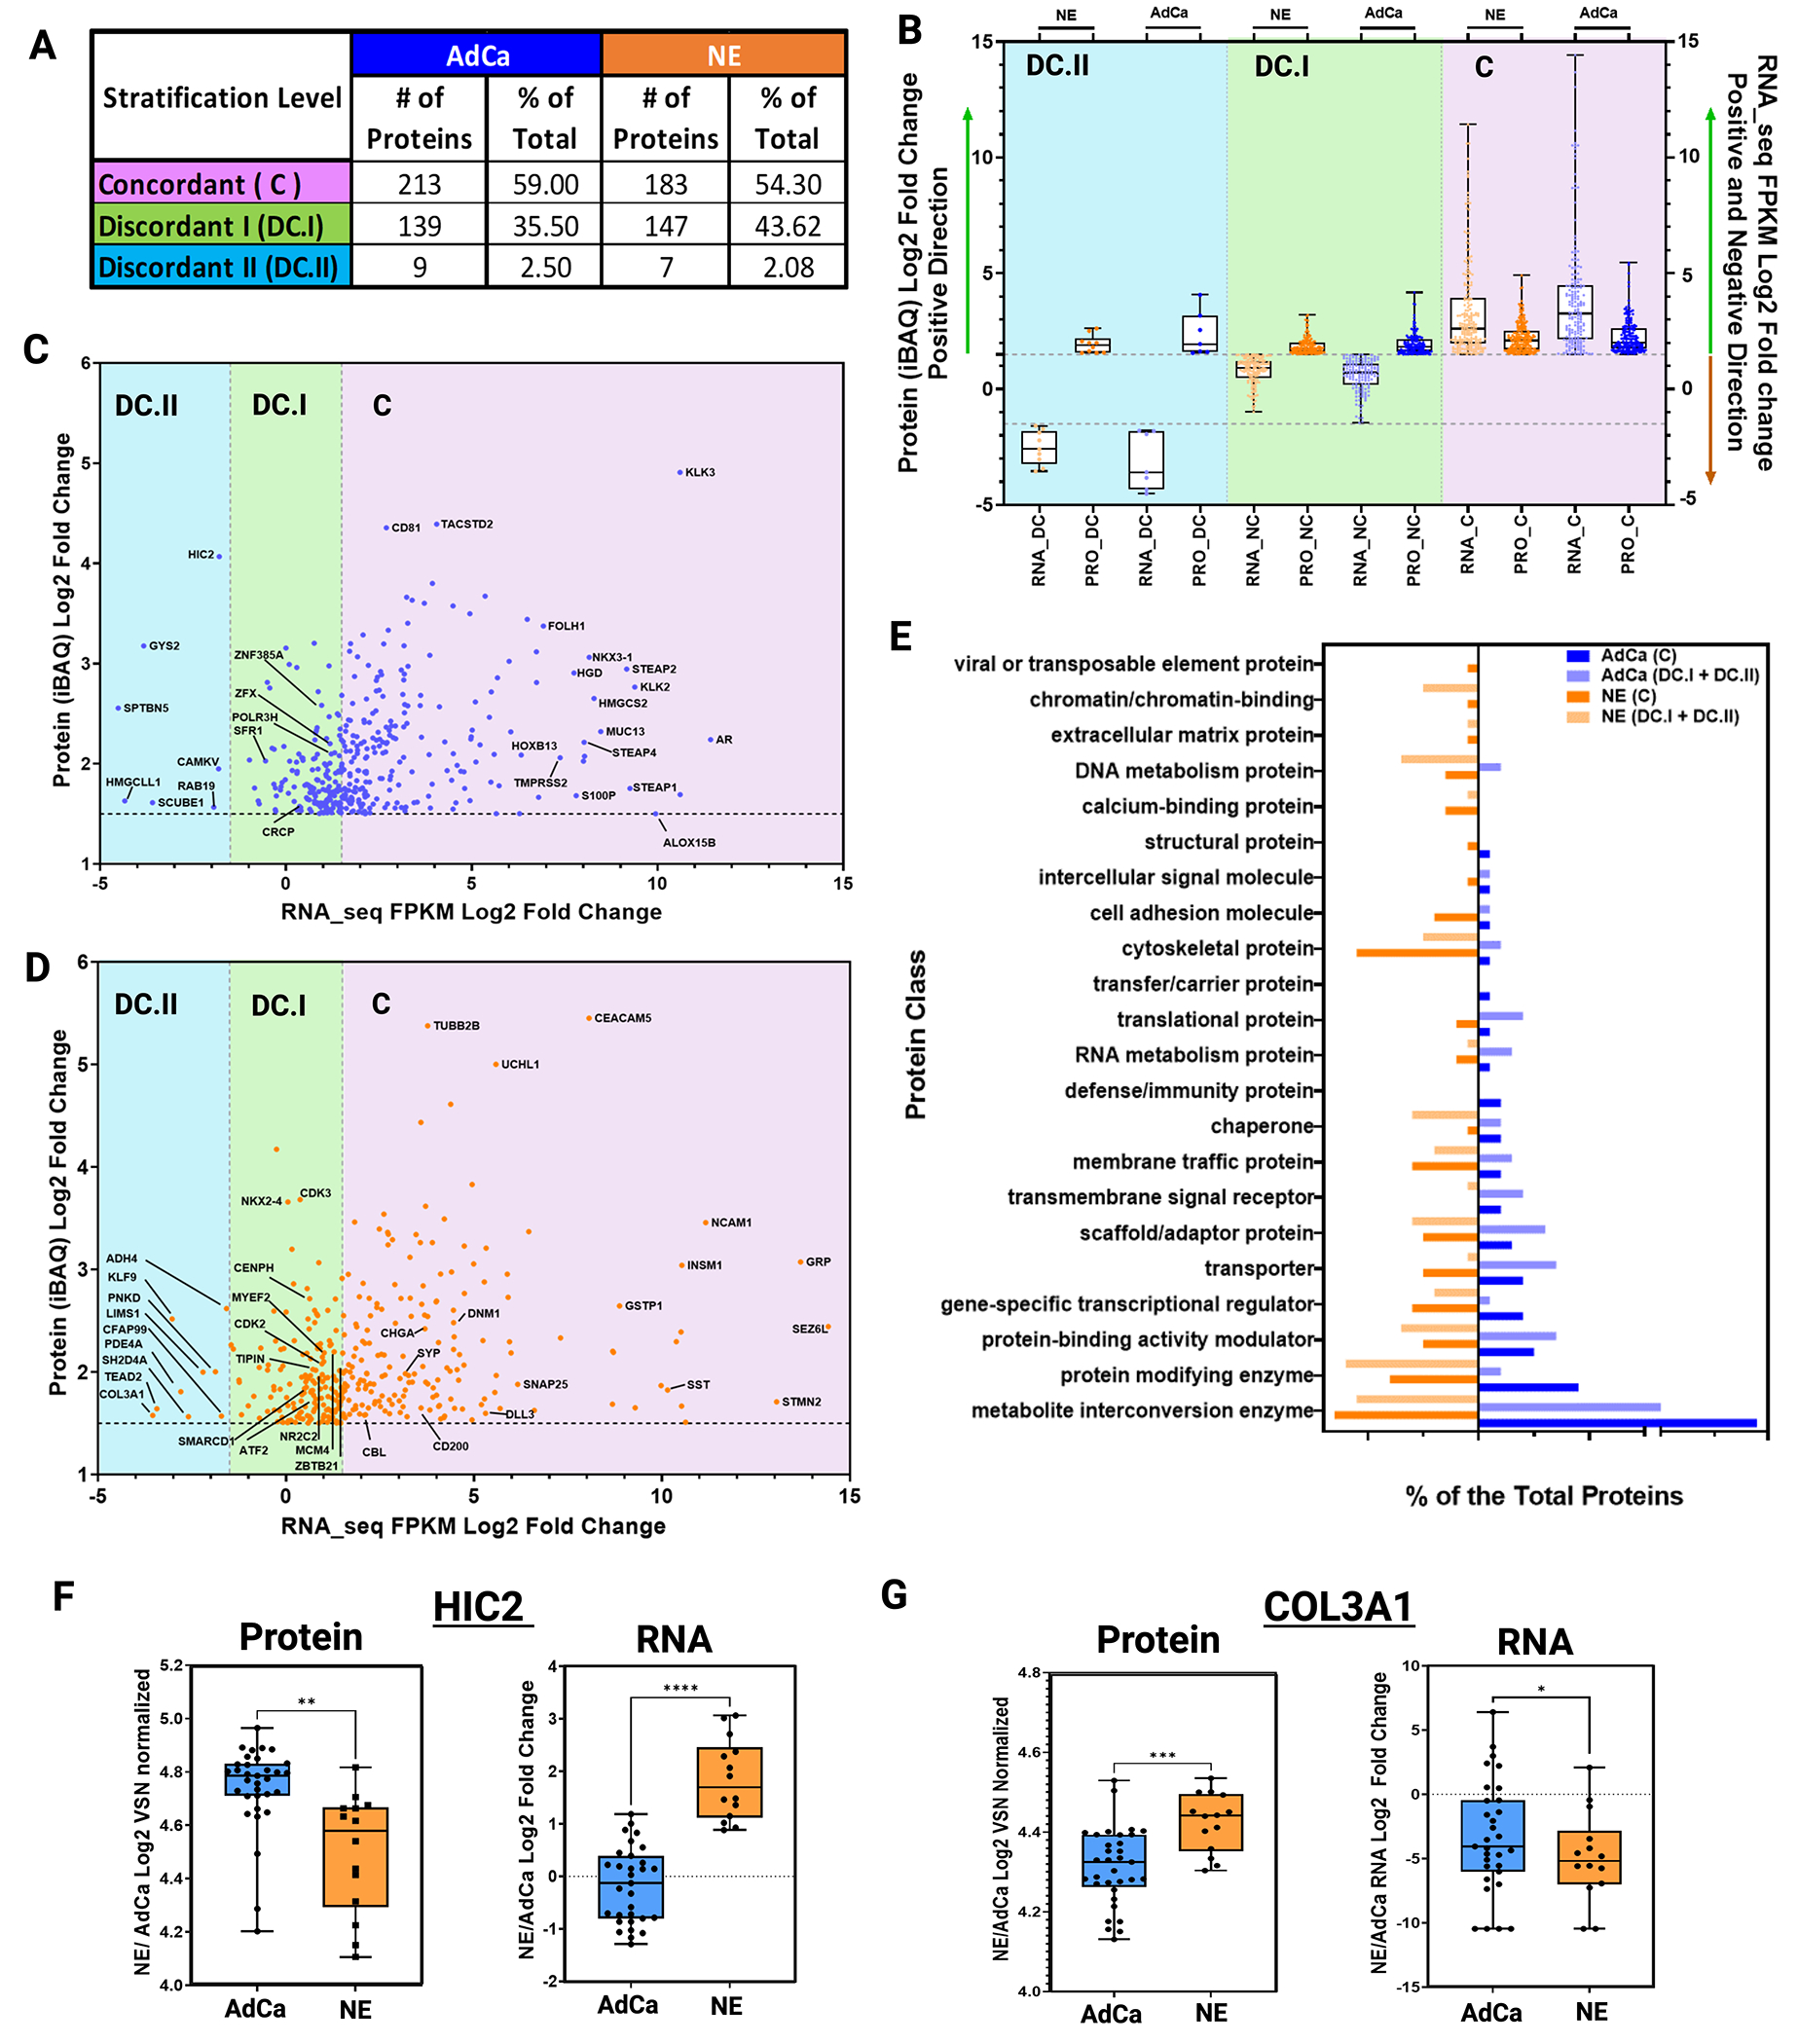
Figure 4. Proteomic and Transcriptomic Data Integration Reveals Dissonance of Targetable Proteins.

A. Table shows the three main stratification levels of protein and mRNA expression agreements, concordant (C); discordant I (DC.I); discordant II (DC.II) and the total number of hyper-abundant proteins in AdCa (n=361) and in NE (n=337) including percent distribution of total, respectively. B. Protein and mRNA Log2 fold change evaluating only the hyper-abundant protein in NE (337 proteins) and AdCa (361 proteins) and simultaneously evaluating the direction of the mRNA expression of those proteins that are stratified as concordant (C; mRNA and protein are upregulated and hyper-abundant), discordant I (DC.I; mRNA is not altered significantly and protein is hyper-abundant) and discordant II (DC.II; mRNA is significantly downregulated while the protein is hyper-abundant). C-D. AdCa and NE hyper-abundant proteins iBAQ (VSN normalized and ROTS p-value adjusted <0.05 significances) mRNA FPKM (ROTS normalized and p-value adjusted <0.05) Log2 fold change highlighting proteins of interest. E. GO protein class analysis of the NE and AdCa concordant and non-concordant plus discordant proteins. Box plots of protein log 2-fold change VSN normalized and mRNA log 2-fold change of n=33 AdCa and n=14 NE evaluating the overall expression in F. HIC-2 and G. COL3A1. Data are represented as mean ± SEM and. ∗∗p < 0.01, ∗∗∗p < 0.001, two-tailed Welch-corrected.
