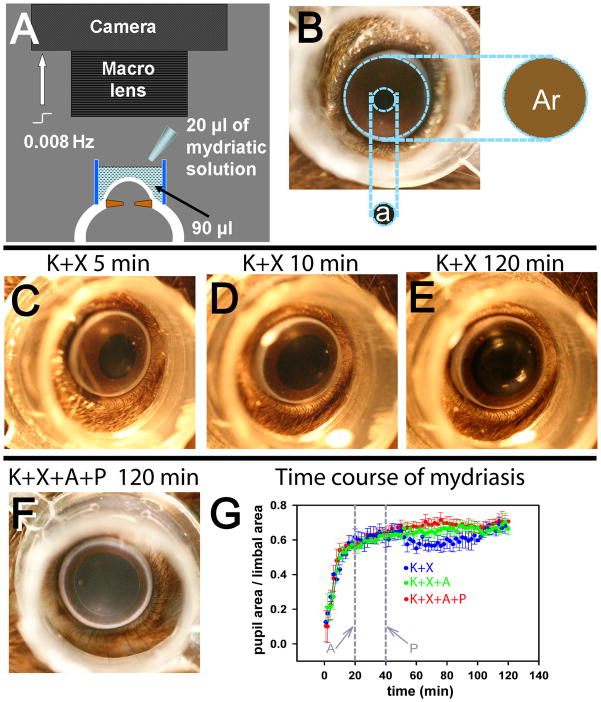
Figure 1. Measurement of pupillary mydriasis.
A, schematic diagram showing the set-up used for recording pupillary mydriasis. A digital-SLR camera fitted with a macro-lens was focused at the pupillary plane of the anesthetized mouse eye. A transparent polypropylene cylinder (outer diameter: 8mm; height: 5 mm) was centered on the cornea and filled with 90 μl 0.25% sodium carboxymethyl-cellulose solution to which 20 μl of mydriatic solution was added. The camera was computer controlled to take images at 0.008 Hz. B, photograph of a mouse eye showing that pupillary area (a) was expressed as a ratio of the area encircled by the limbus (Ar). C,D,E, representative photographs of a single mouse eye, showing levels of mydriasis 5, 10 and 120 min after ketamine+xylazine anesthesia. F, representative photograph of a mouse eye, taken 120 min after ketamine+xylazine (K+X) anesthesia and topical atropine + phenylephrine administration (topical atropine (A): 20 min and topical phenylephrine (P): 40 min after induction of anesthesia). G, time course of average mydriasis expressed as a ratio of the limbal area, produced by K+X anesthesia (blue circles, n=4), K+X anesthesia followed by A administered at 20 min from induction of anesthesia (green circles, n=3) and K+X anesthesia followed consecutive administration of A at 20 min and P at 40 min from induction of anesthesia (red circles, n=4). Vertical grey lines: time at which A and P were administered.

