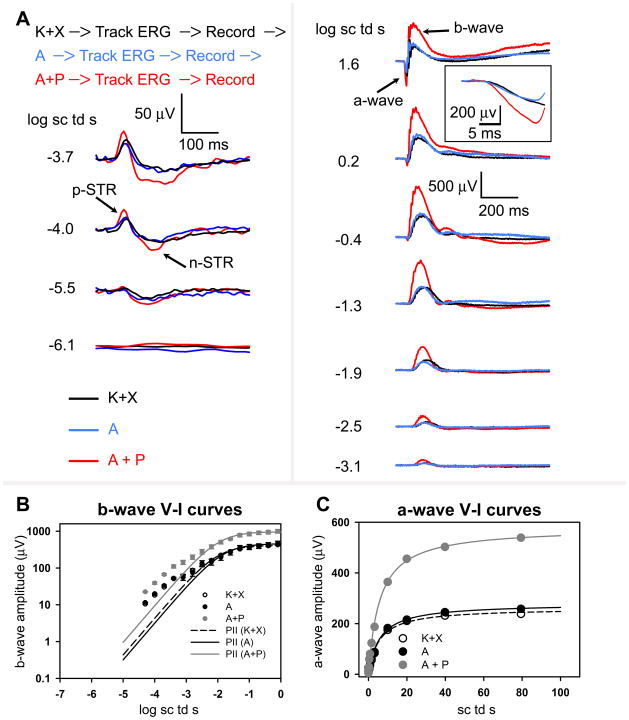
Figure 4. Dark-adapted ERG responses to brief full-field flashes of increasing energy after anesthesia and after consecutive topical application of atropine and atropine + phenylephrine in anesthetized mice.
A, top, order of events in this experimental paradigm. Track ERG: Dark-adapted ERGs were tracked with −1.3 log sc td s flashes (0.2 Hz) until the responses were of uniform amplitude. Record: ERG responses to brief full-field flashes of increasing energy were recorded. Dark-adapted ERGs recorded in a single experimental session from a mouse after anesthesia (K+X, black-trace) and after subsequent instillation of topical atropine (A, blue trace) followed by a combination of topical atropine + phenylephrine (A+P, red trace). Left column: ERG responses to low energy flashes (from bottom to top: −6.1 to −3.7 log sc td s) shows augmentation of the negative scotopic threshold response (nSTR) and the positive STR (pSTR) (arrows) only subsequent to topical application of atropine + phenlyephrine but not for topical atropine in K+X anesthetized mice. Right column: ERG response to flashes of intermediate to high-energy (from bottom to top: −3.1 to 1.6 log sc td s) shows augmentation of the photoreceptor-derived a-wave and the ON bipolar cell derived b-wave only subsequent to topical application of atropine + phenylephrine but not for topical atropine in the K+X anesthetized mice. Inset: The a-wave plotted on an expanded time-scale (1.6 log sc td s).
B, left: ERG b-wave amplitudes (group mean ± one S.E.M.) plotted as a function of stimulus energy after ketamine + xylazine anesthesia (K+X) (open circles) and after subsequent instillation of topical atropine (A, black circles) followed by a combination of topical atropine + phenylephrine (A+P, grey circles). The data-points, fitted with the Fulton-Rushton function represent the voltage-energy relationship of the PII after ketamine + xylazine anesthesia (K+X) (dashed curve) and PII after subsequent instillation of topical atropine (A, black curve) followed by a combination of topical atropine + phenylephrine (A+P, grey curve). Right: ERG a-wave amplitudes (group mean ± one S.E.M.) plotted as a function of stimulus energy after ketamine + xylazine anesthesia (K+X) (open circles) and after subsequent instillation of topical atropine (A, black circles) followed by a combination of topical atropine + phenylephrine (A+P, grey circles). The data-points were fitted with the Fulton-Rushton function to characterize the voltage-energy relationship for ketamine + xylazine anesthesia (K+X) (dashed curve) and after subsequent instillation of topical atropine (A, black curve) followed by a combination of topical atropine + phenylephrine (A+P, grey curve).

