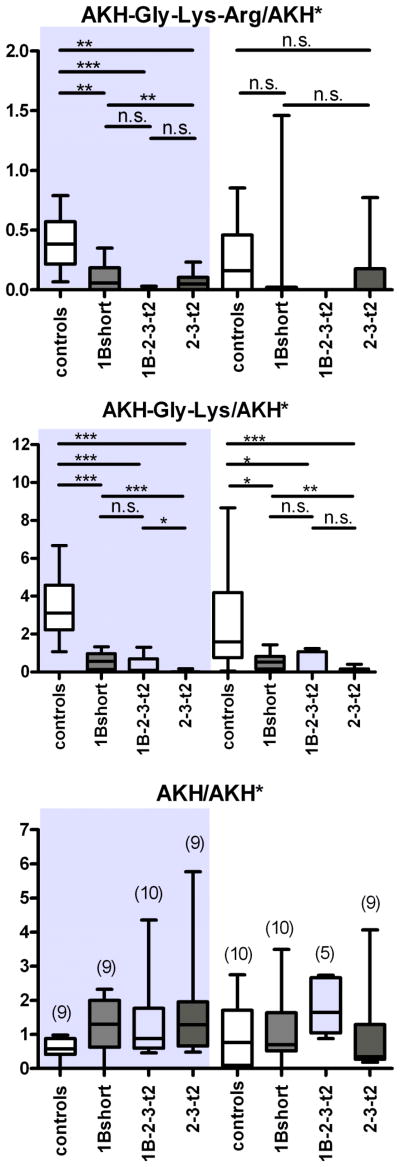
Figure 7.
Mass spectrometric quantification of AKH and processing intermediates in the corpora cardiaca of transgenic CPD mutants. Left side (shaded): adult male flies, right side: adult female flies. UAS:svr was used as control. Levels of A. AKH-Gly-Lys-Arg. B. AKH-Gly-Lys and C. AKH, measured as intensity ratio using heavy isotope-labeled AKH* as internal standard. n is shown in brackets in C. * p<0.05, ** p<0.01, *** p<0.001, n.s. = not significant (Mann-Whitney test).

