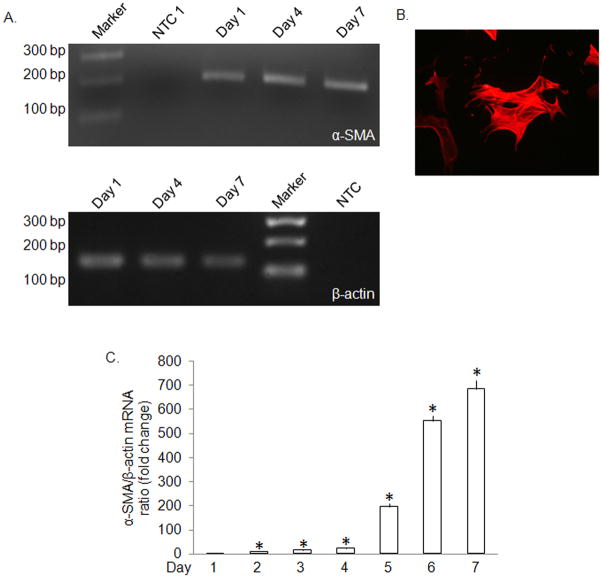
Fig. 1.
α-SMA production by primary culture mHSC. (A) Reverse-transcriptase PCR of total cellular RNA extracted from primary mHSC for determination of α-SMA gene expression on Day 1, Day 4 or Day 7 of primary culture. A DNA marker ladder and non-cDNA template (NTC) are also shown. (B) Immunofluorescent detection of α-SMA protein in Day 3 mHSC (magnification X100). This staining pattern was seen in about 40% of the cells on Day 3. (C) Quantitative real-time PCR detection of α-SMA mRNA on Days 1–7. Data are the means ± SD of triplicate determinations and are representative of three independent experiments. *p<0.05 vs Day 1.

