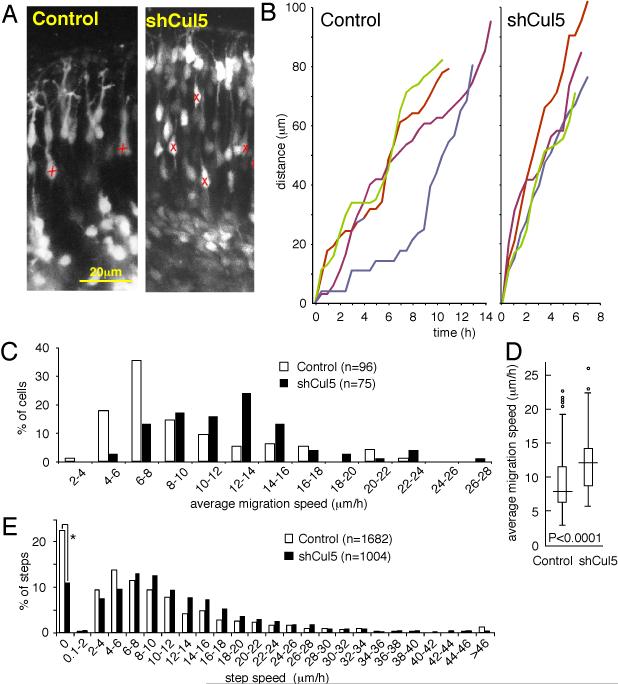
Figure 5. Cul5 regulates neuron migration speed.
2 μg of pCAG-GFP+Mfe or pCAG-GFP-shCul5 DNA were microinjected in wild-type embryos at E14.5. At E16.5, live slices were prepared and fluorescent neurons were followed by confocal videomicroscopy as described in Materials and Methods.
(A) Portions of still images from movies (see Supplementary Material for movie). X, neuron whose position was tracked over several images. Scale bar, 20 μm.
(B) Tracking of four individual control (left) and shCul5 (right) neurons over time. Different neuron tracks are colored red, green, blue, indigo. Both control and shCul5 neurons exhibit saltatory movement upward through the CP.
(C) Average migration speeds determined for each of 96 control or 75 shCul5 neurons by averaging the speeds of individual 30 min steps taken between consecutive frames. Data taken from 5 control movies and 3 shCul5 movies.
(D) Box and whisker plot of data: horizontal line, median; box, 25th to 75th percentile; vertical line, 5th to 95th percentile; circles, outliers. P<0.0001, two-sample Kolmorogov-Smirnov test.
(E) Individual step speeds. The shCul5 neurons were approximately one-half as likely to be stationary between sequential frames (*, 11% versus 22%). When moving, shCul5 moved at ~18% higher instantaneous speeds (median instantaneous speeds of moving neurons: 10.5 versus 8.85 μm/h; P<0.0001, two-sample Kolmorogov-Smirnov test).

