
Figure 9. Identification of CART-expressing CeA neurons as targets of leptin action.
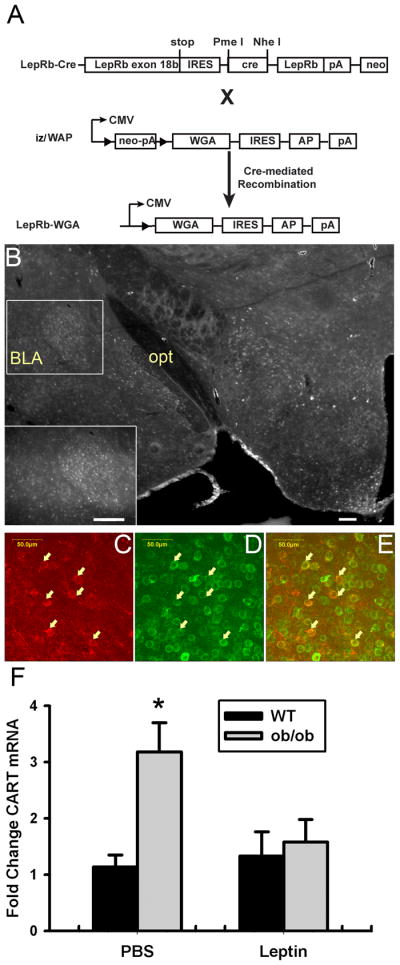
(A) Schematic diagram showing the generation of LepRb-WGA mice. Leprcre mice were crossed with iZ/WAP transgenic mice to mediate the expression of the trans-synaptic tracer, WGA, in LepRb neurons. (B) WGA-IR in the hypothalamus and amygdala of a LepRb-WGA mouse. Inset: Higher-magnification image showing WGA-IR in the CeA. Scale bars are 200 microns. (C–E) WGA-IR (green, C), CART-IR (red, D), and merged (F) confocal images from the CeA of a LepRb-WGA mouse. Arrows indicate colocalized neurons. Scale bars as indicated. (E) Wild-type (WT) and leptin deficient Lepob/ob (ob/ob) mice were treated for with leptin (5 mg/kg, i.p.) or vehicle q12 hours for 24 hours before dissection and mRNA extraction from the CeA. Expression of Cart mRNA was quantified by qPCR. n=9–10 per group, *p<0.05 compared to WT by ANOVA.