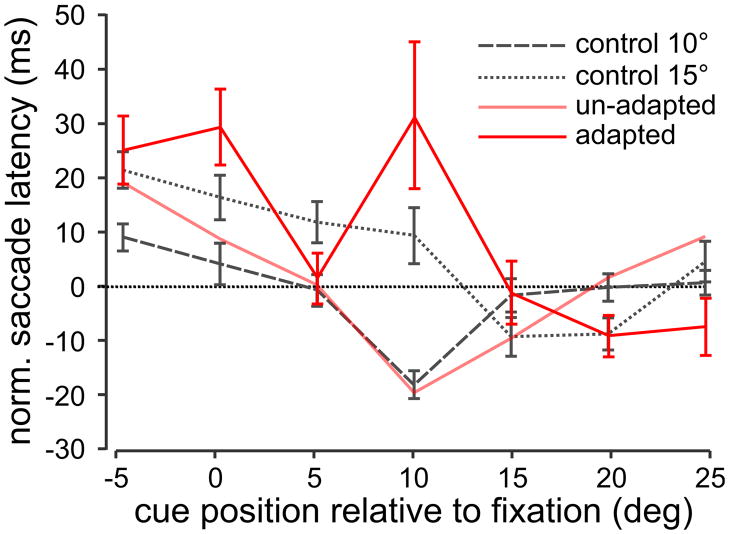
Figure 5. Un-adapted saccade latencies.
A. Average un-adapted normalized saccade latencies across all subjects for the 15° to 10° adapted saccade condition plotted as a function of cue position (thicker red line) as in Figure 3. Un-adapted saccades were defined as saccades that fell within ± 2° of the 1st target position as shown by the gray region in Figure 3A. For comparison reasons, the 10° and 15° control and adapted saccade latencies are re-plotted as well as the adapted saccade latency curve from Figure 4E (light red line).

