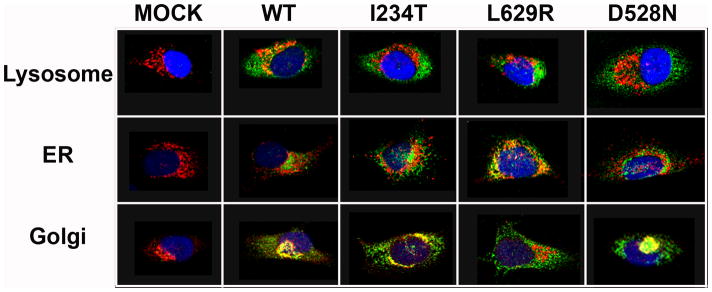
Figure 3. Confocal immunocytofluorescent analysis of GALC in H4-GALC cells.
H4 cells (Mock), WT GALC, and mutant (I234T, L629R and D528N) GALC-expressing H4 cells were seeded at subconfluent density on glass cover slips one day before staining. The subcellular localization of GALC was analyzed by co-staining of GALC (CL1475 rabbit anti-GALC antibody) and lamp 2 for lysosomes, costaining of GALC (anti-V5 antibody) and calnexin for ER, and costaining of GALC (anti-V5 antibody) and 58k golgi protein for golgi apparatus. GALC and the organelle markers were illustrated in green and red colors, respectively. Nuclei were labeled with DAPI and illustrated in blue color. Yellow color indicates co-localization of GALC with the organelle markers. All images were captured in 40x magnification using a Zeiss LSM 510 META confocal microscope.

