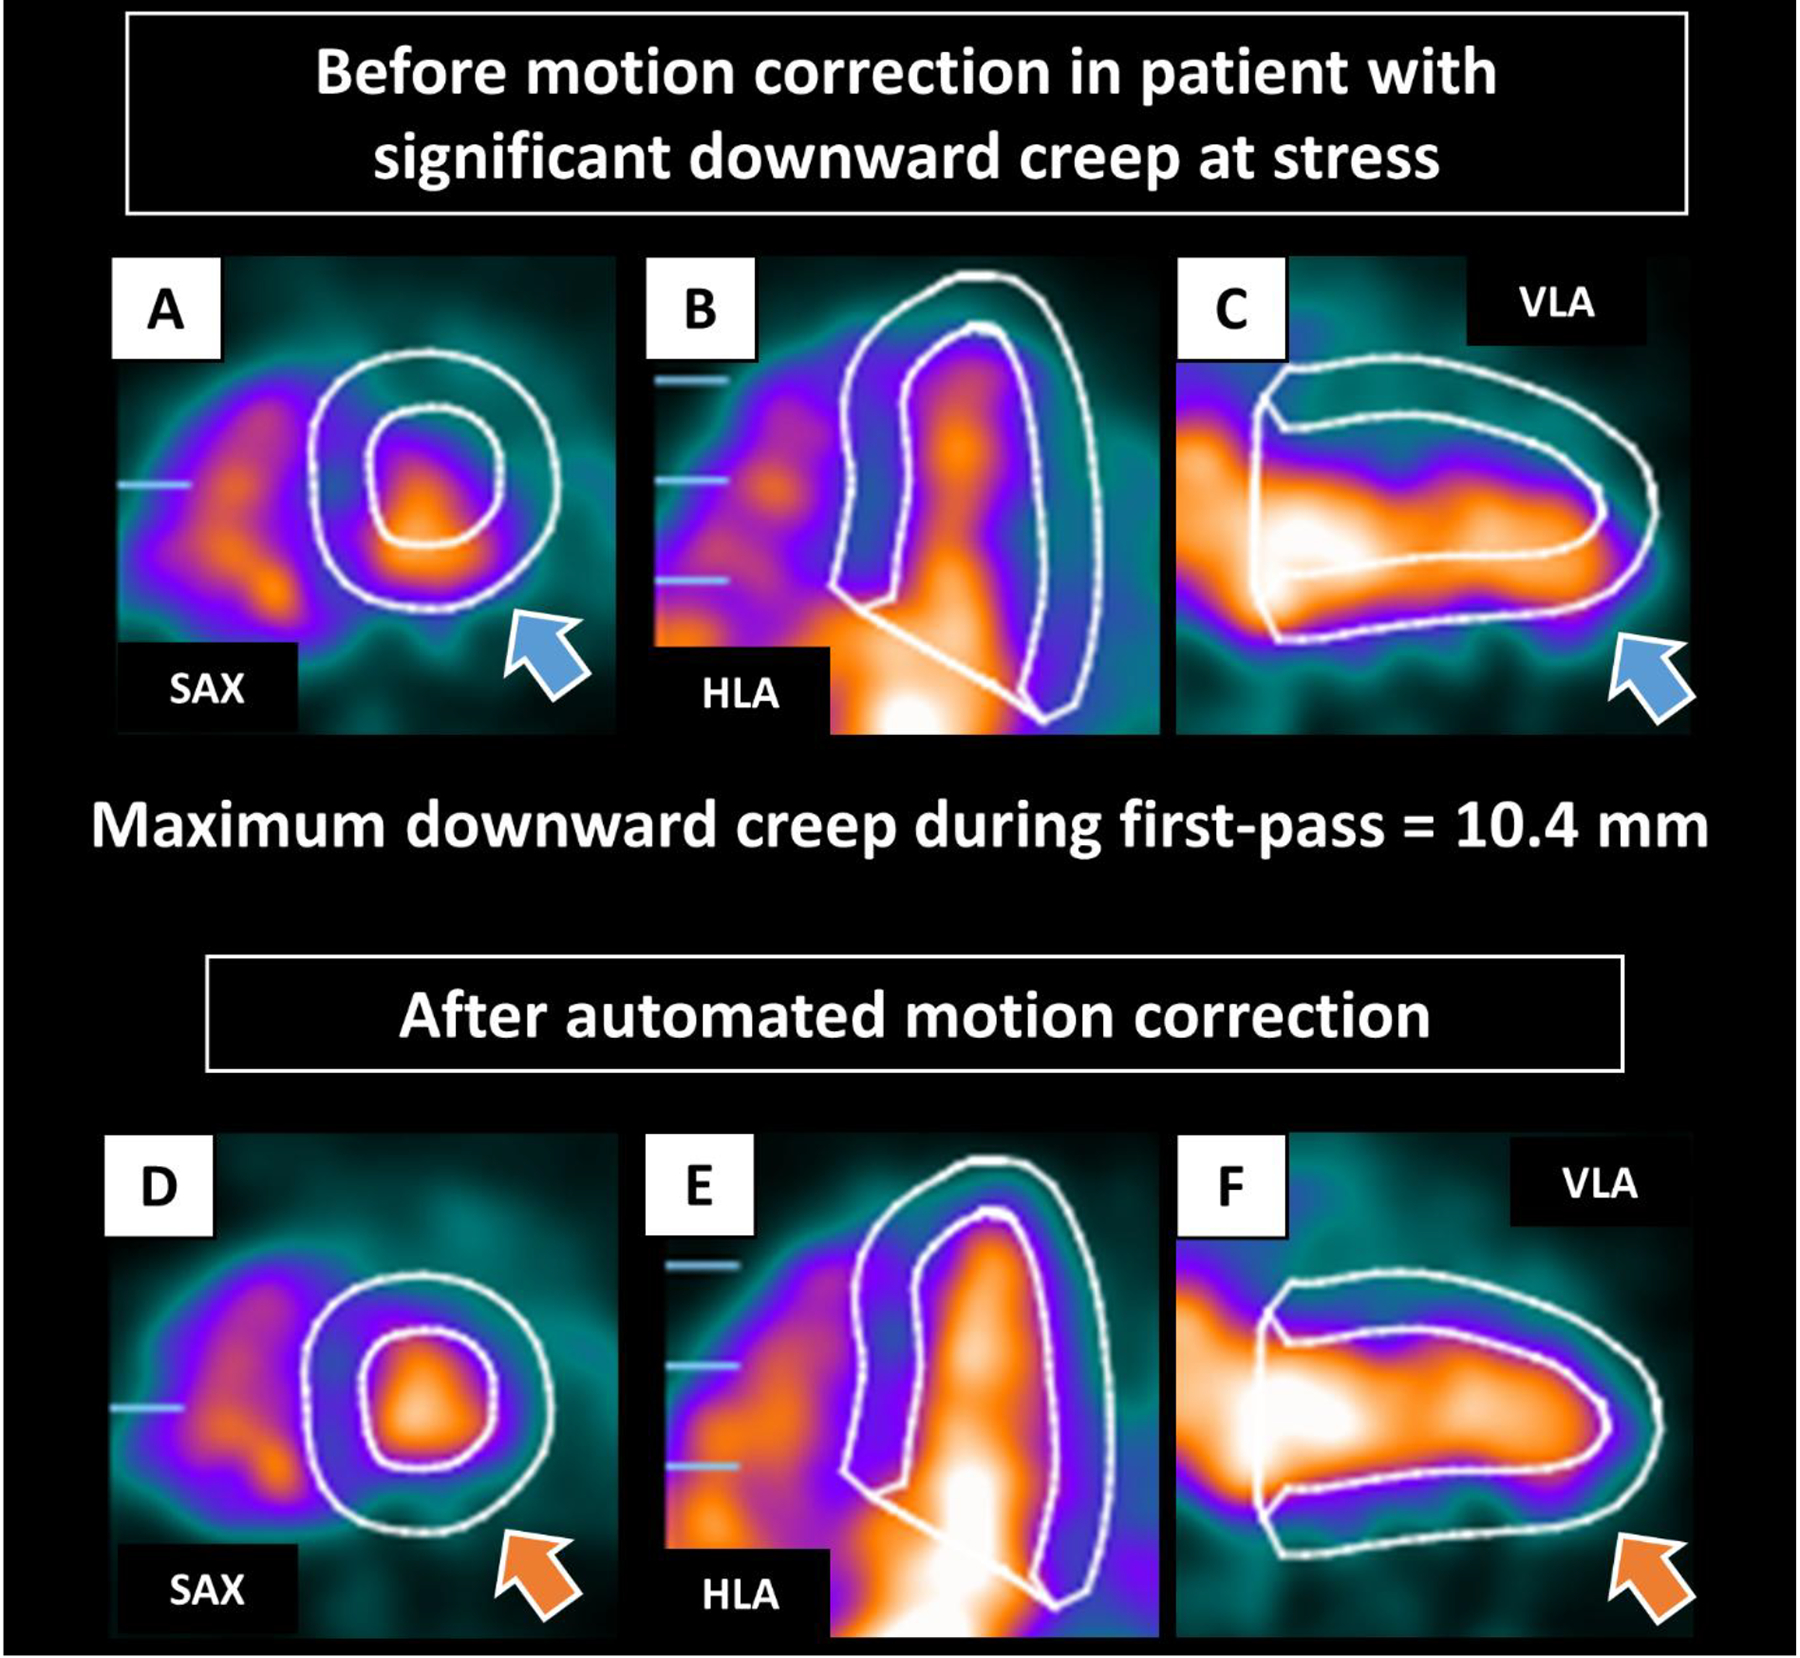
Fig. 1.

Case example of early dynamic images before (A-C) and after (D-F) automated motion correction in patient with significant downward creep at stress. The LV contours before motion correction were automatically positioned from the static imaging. Before correction, the inferior LV contour overlaps substantially with the activity of the LV blood pool, and the anterior LV contour is far from the actual LV myocardium (blue arrows). Those were corrected after automated motion correction (orange arrows). HLA, horizontal long axis; LV, left ventricle; SAX, short axis; VLA, vertical long axis
