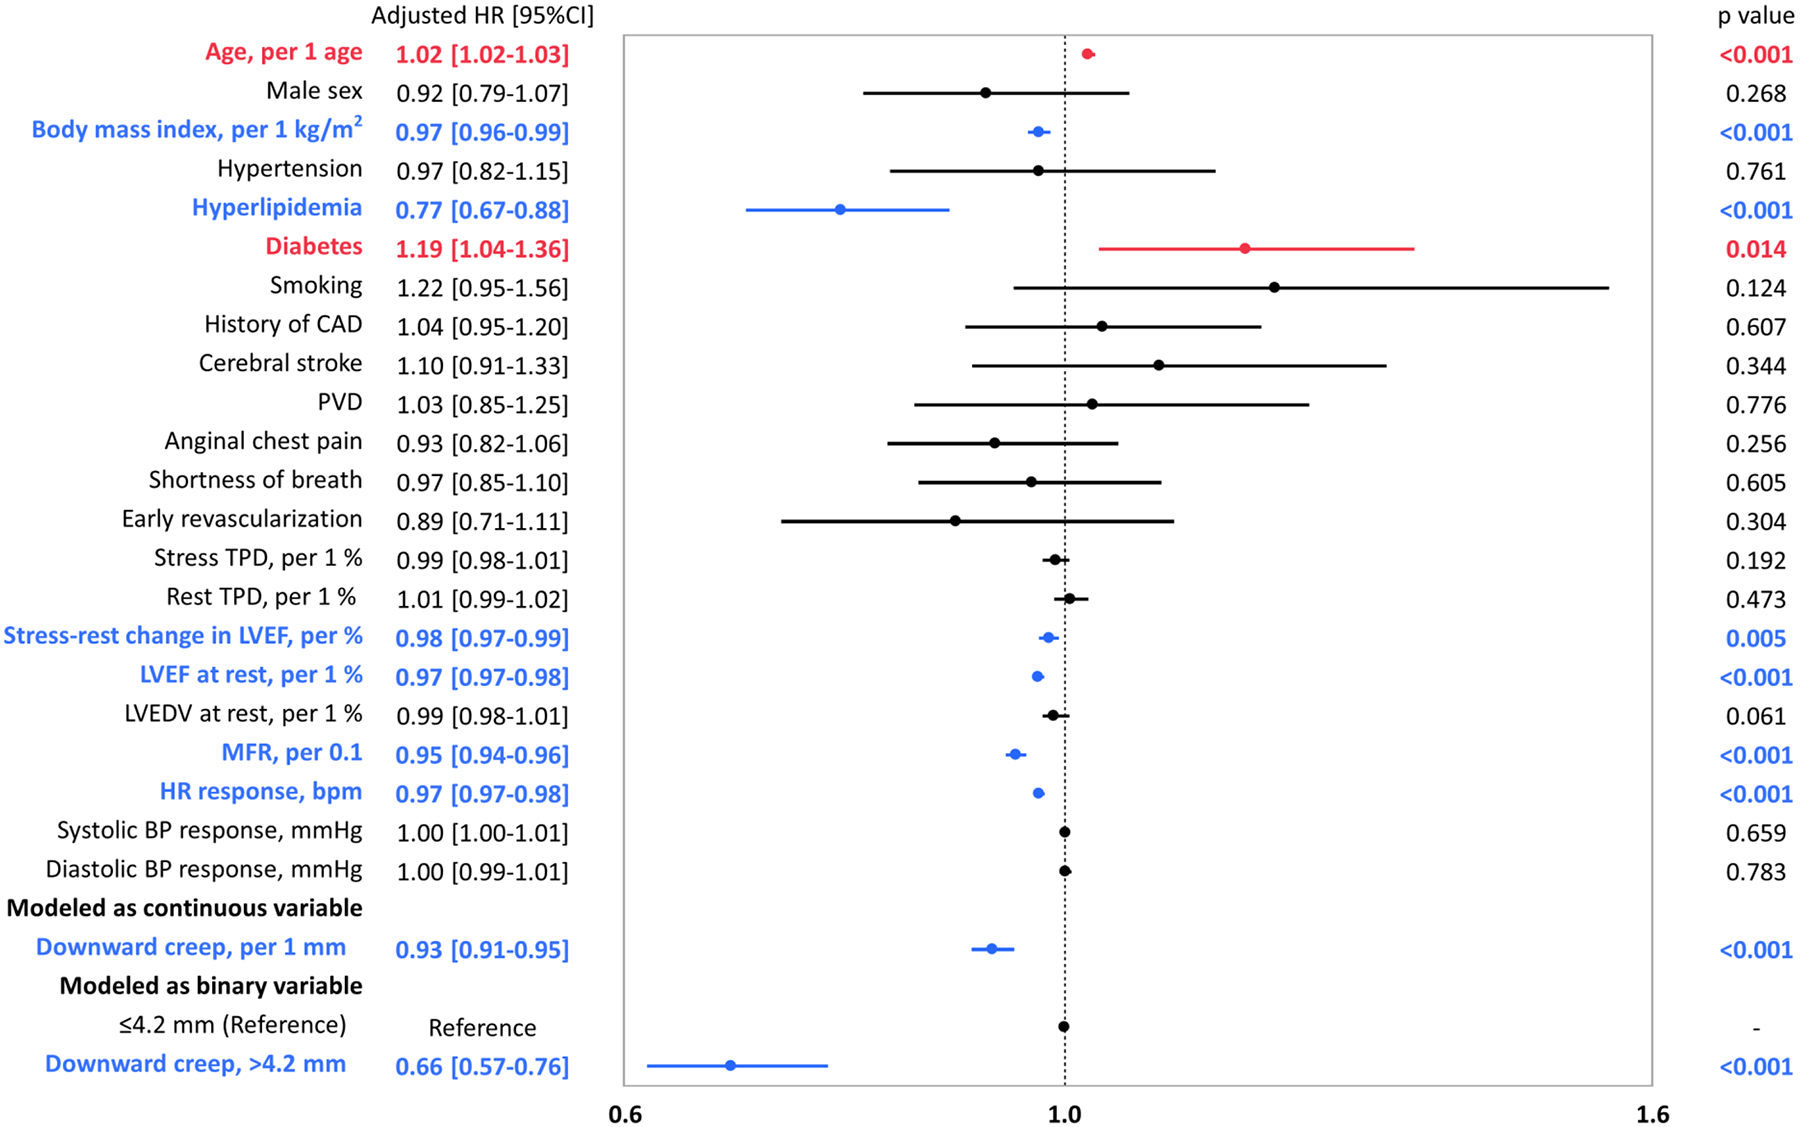
Fig. 4.

Forest plot of multivariable adjusted HRs for ACM
Blue bars indicate the variables are significantly and negatively associated with ACM. Red bars indicate the variables are significantly and positively associated with ACM. Black bars indicate the variables are not significantly associated with ACM. ACM, all-cause mortality; BMI, body mass index; BP, blood pressure; CAD, coronary artery disease; HR, hazard ratio; LVEDV, left ventricular end-diastolic volume; LVEF, left ventricular ejection fraction; MFR, myocardial flow reserve; PVD, peripheral vascular disease; TPD, total perfusion deficit
