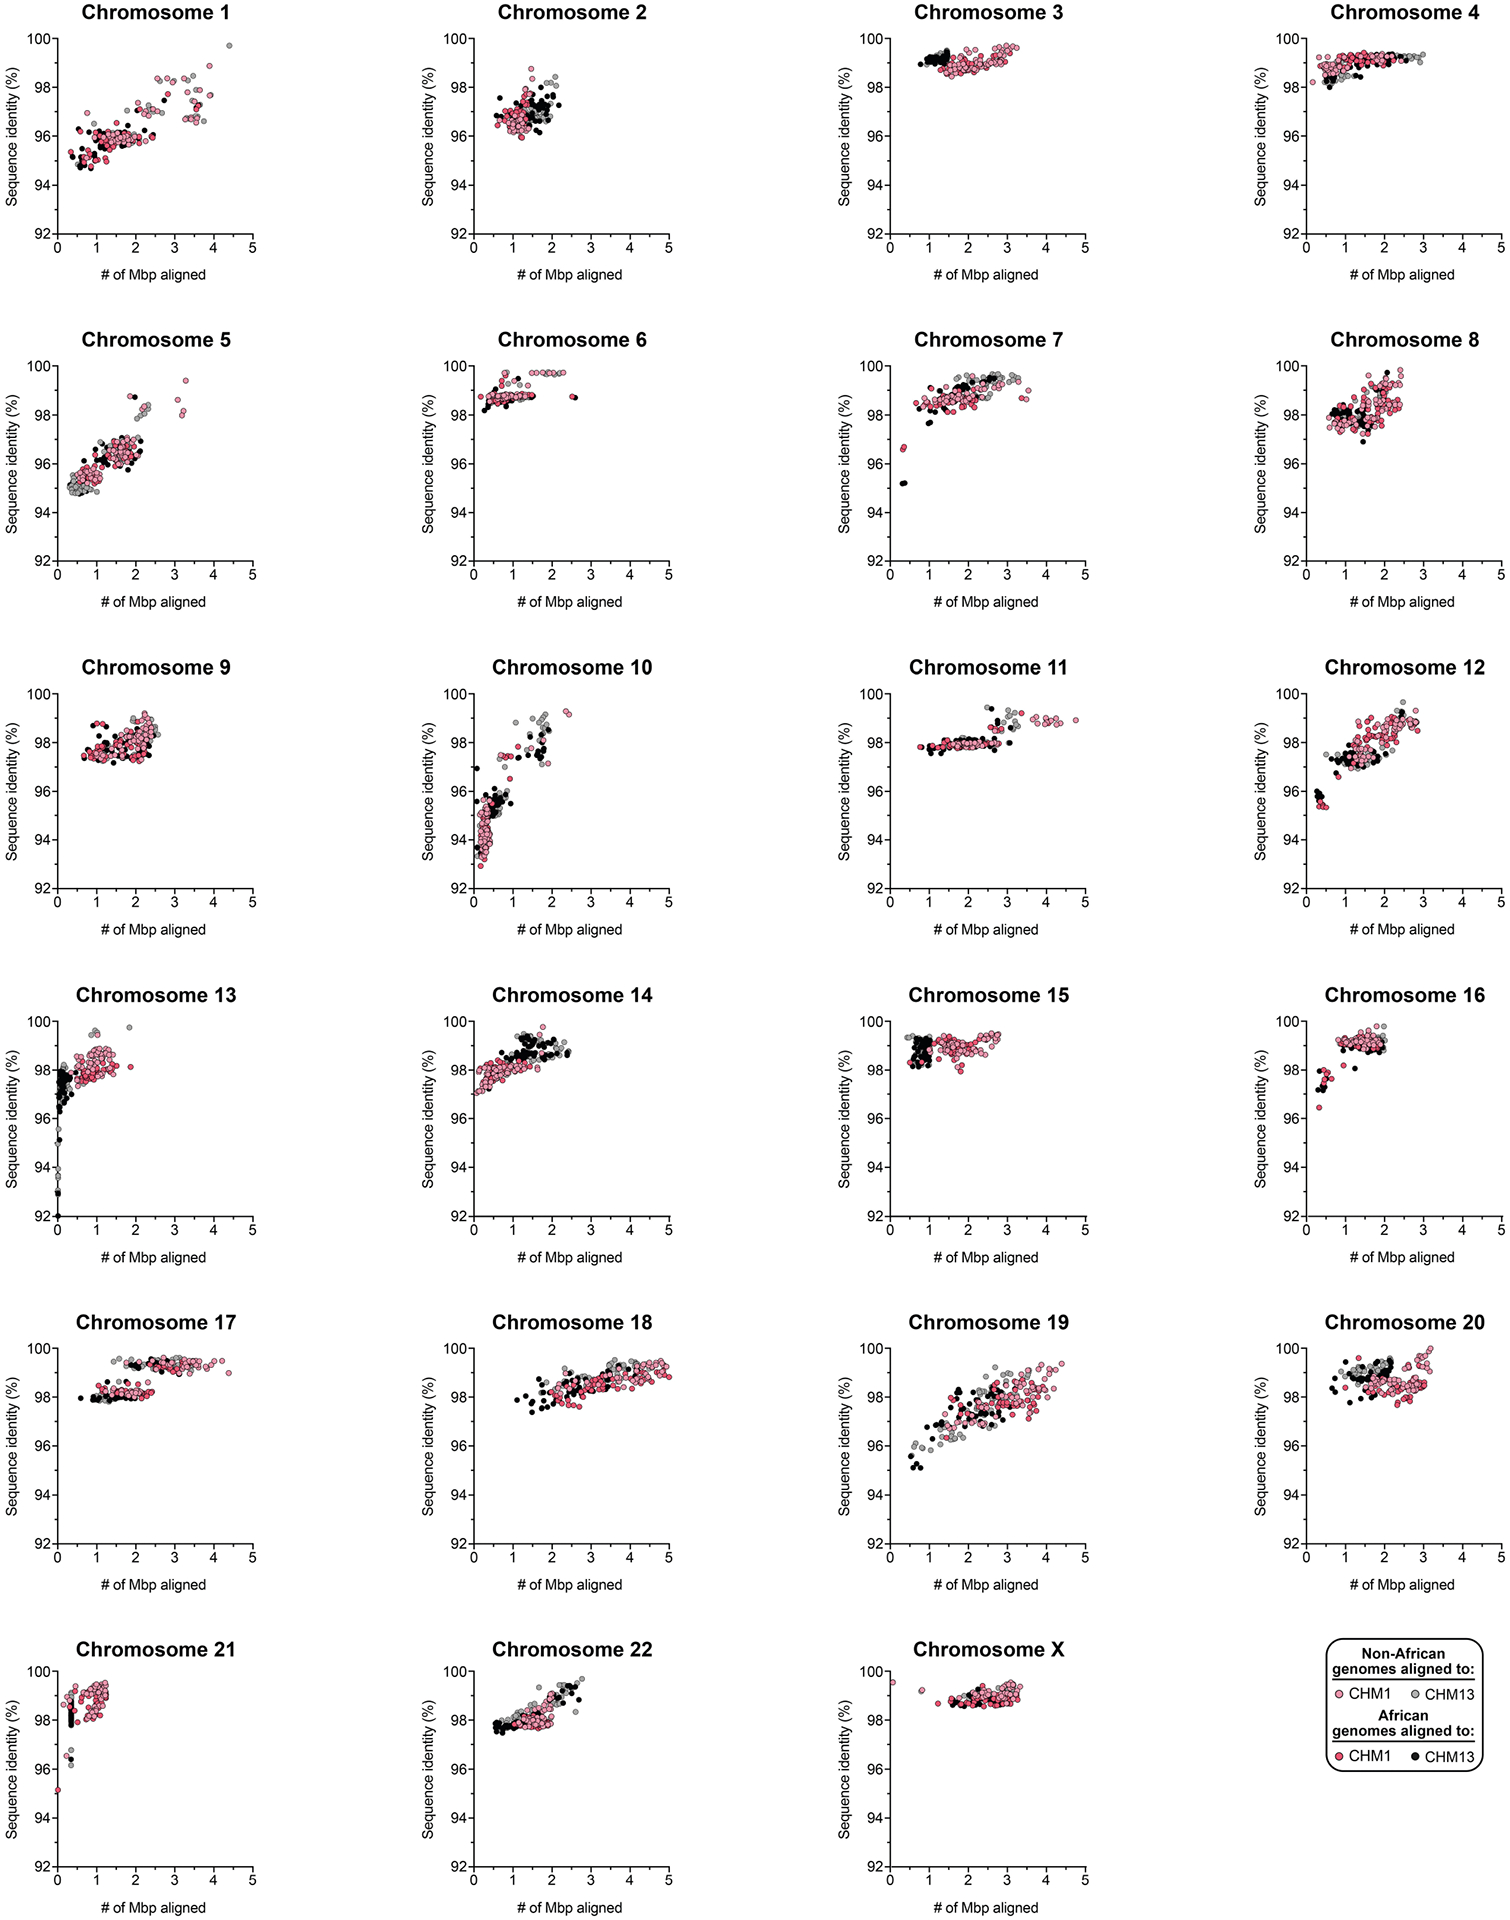
Extended Data Fig. 4 |. Comparison of CHM1 and CHM13 centromeric α-satellite HOR arrays to those from 56 diverse human genomes.

Plots showing the percent sequence identity and number of megabase pairs (Mbp) aligned for 56 diverse human genomes (112 haplotypes), generated by the HPRC10 and HGSVC23, mapped to the CHM1 and CHM13 centromeric regions. Note that each data point represents a haplotype with 1:1 best mapping, although many of the centromeres are not yet complete in the HPRC and HGSVC assemblies. Enlarged versions of these plots are shown in Supplementary Figs. 18, 19.
