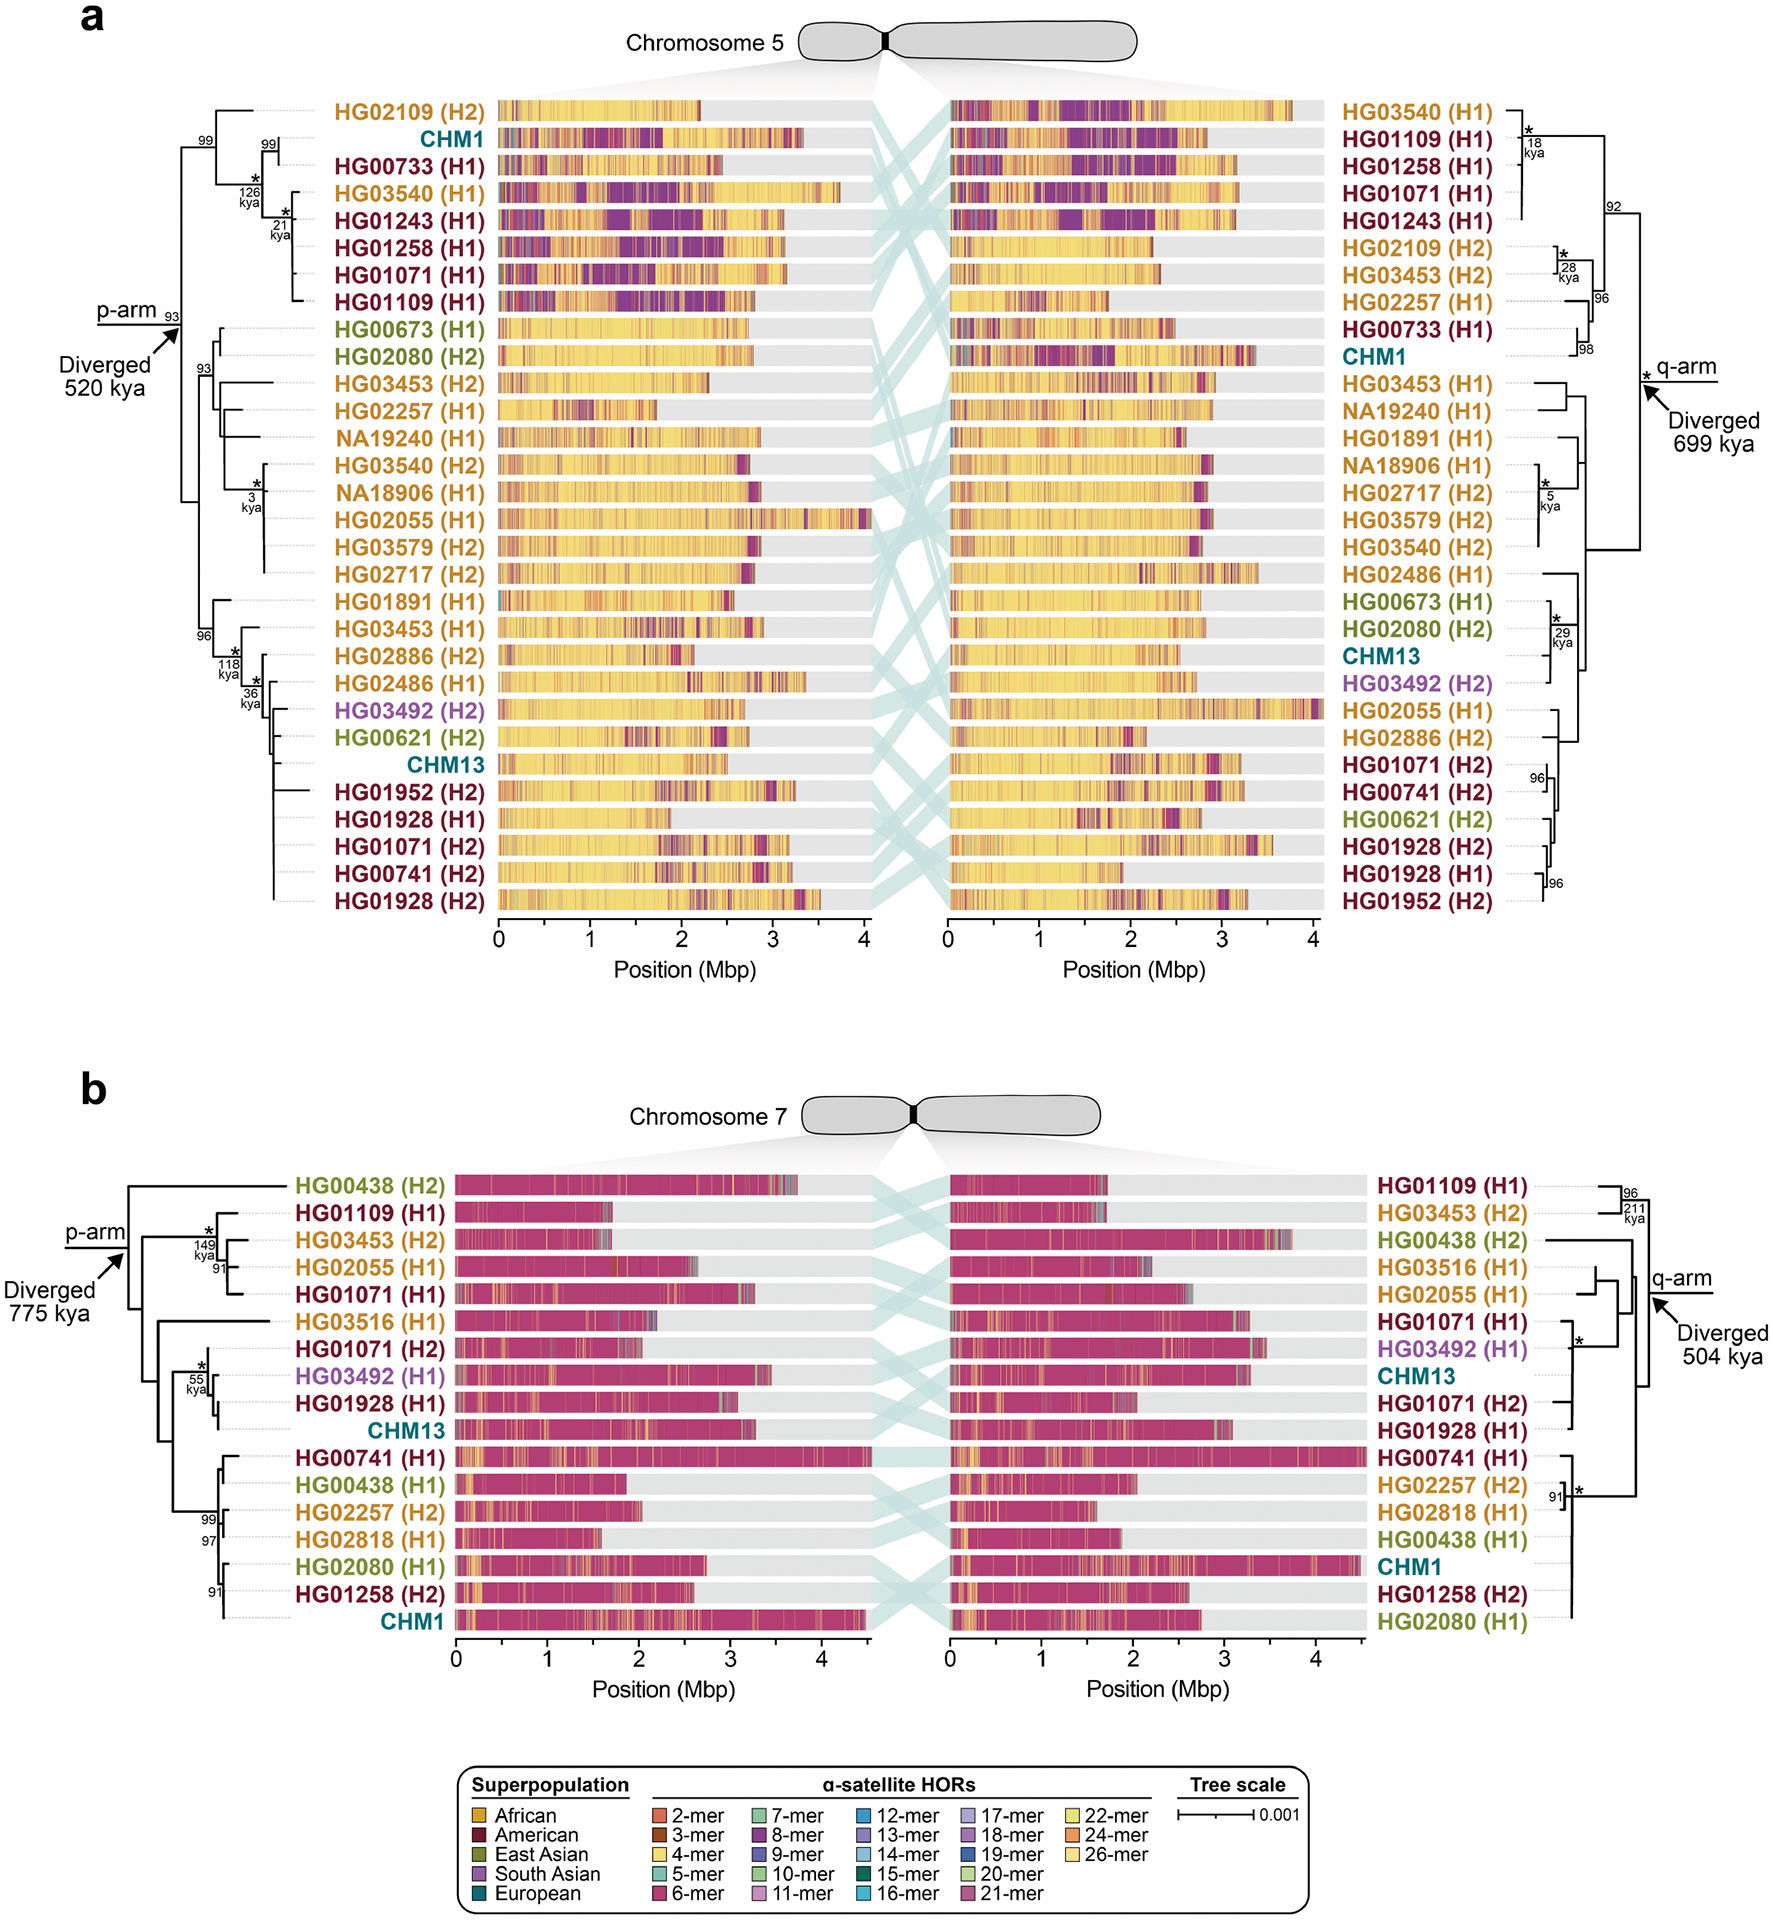
Extended Data Fig. 9 |. Phylogenetic reconstruction of human chromosome 5 and 7 centromeric haplotypes.

a,b) Phylogenetic trees showing the evolutionary relationship and estimated divergence times of completely and accurately assembled a) D5Z2 α-satellite HOR arrays and b) D7Z1 α-satellite HOR arrays from CHM1, CHM13, and diverse human samples (generated by the HPRC10 and HGSVC23). The trees were generated from 20-kbp segments in the monomeric α-satellite or unique sequence regions on the p- (left) and q- (right) arms. Asterisks indicate nodes with 100% bootstrap support, and nodes with 90–99% bootstrap support are indicated numerically. Nodes without an asterisk or number have bootstrap support <90%. The haplotypes from the p- and the q-arm trees are linked with a light teal bar, as schematized in panel a. We note that most differences in the order of the haplotypes occur at the terminal branches where the order of sequence taxa can be readily reshuffled to establish near-complete concordance. Thus, there are no significant changes in the overall topologies of the phylogenetic trees.
