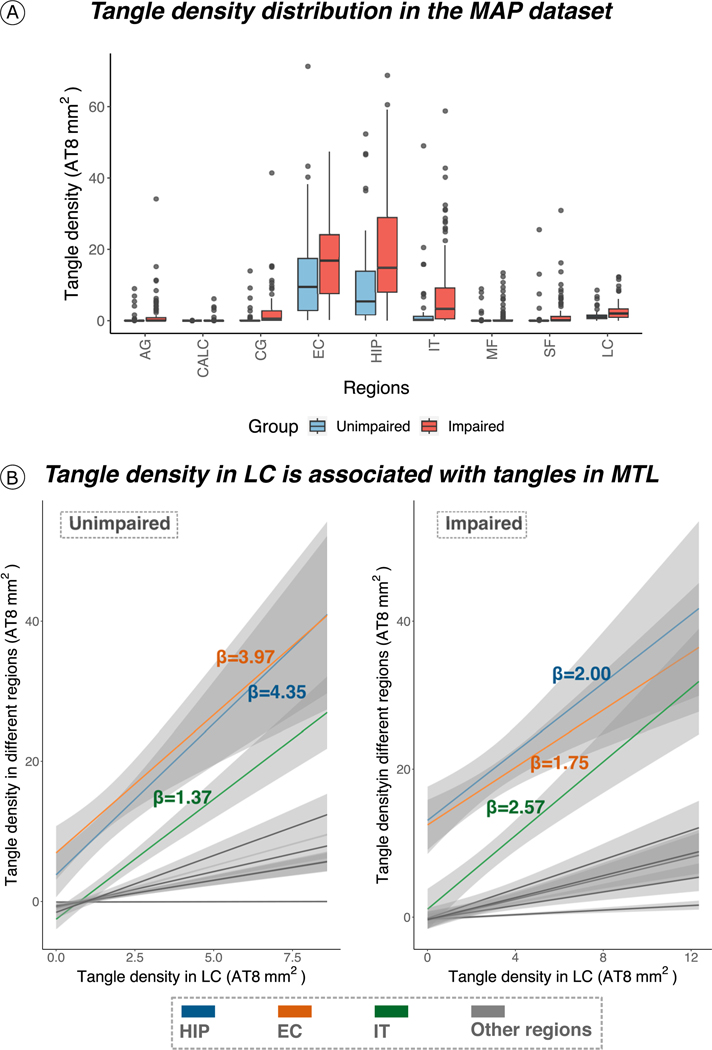
Extended Data Fig. 7 |.
Tangle density in LC is associated with early affected tau cortical regions. (a) Tangle density distribution in the MAP dataset. In both unimpaired and impaired (MCI/AD) individuals, tangle density is higher in the MTL (EC and hippocampus) compared to other regions (the boxplots covers the interquartile range (IQR): the centerline of the boxplot corresponds to the median (Q2), the lower and upper bound of the boxplots correspond to the 25th percentile (Q1) and the 75th percentile (Q3) respectively, the error bar minimum value is the minimum value in the data (Q1–1.5*IQR) and the maximum value is the maximum value in the data (Q3 + 1.5*IQR). (b) Tangle density in LC is strongly related to tangle density in MTL (that is, hippocampus and entorhinal cortex), and in IT (restricted robust linear regression with age, sex and postmortem interval as covariates, two-tailed analysis, all p < 0.05; regression lines represent slope between the relationships tested and the shaded areas around the fit lines show 95% CI). Sample size for (A) and (B) (unimpaired | impaired): AG = 65|94 individuals; CALC = 66|94 individuals; CG = 66|94 individuals; EC = 65|93 individuals; HIP = 66|94 individuals; IT = 66|94 individuals; MF = 66|94 individuals; SF = 66|94 individuals; LC = 66|94 individuals. Abbreviations: AG=angular gyrus; CALC= calcarine; CG=cingulate cortex; EC=entorhinal cortex; HIP=hippocampus; IT=inferior temporal cortex; LC=locus coeruleus; MF=midfrontal gyrus; SF=superior frontal gyrus.

