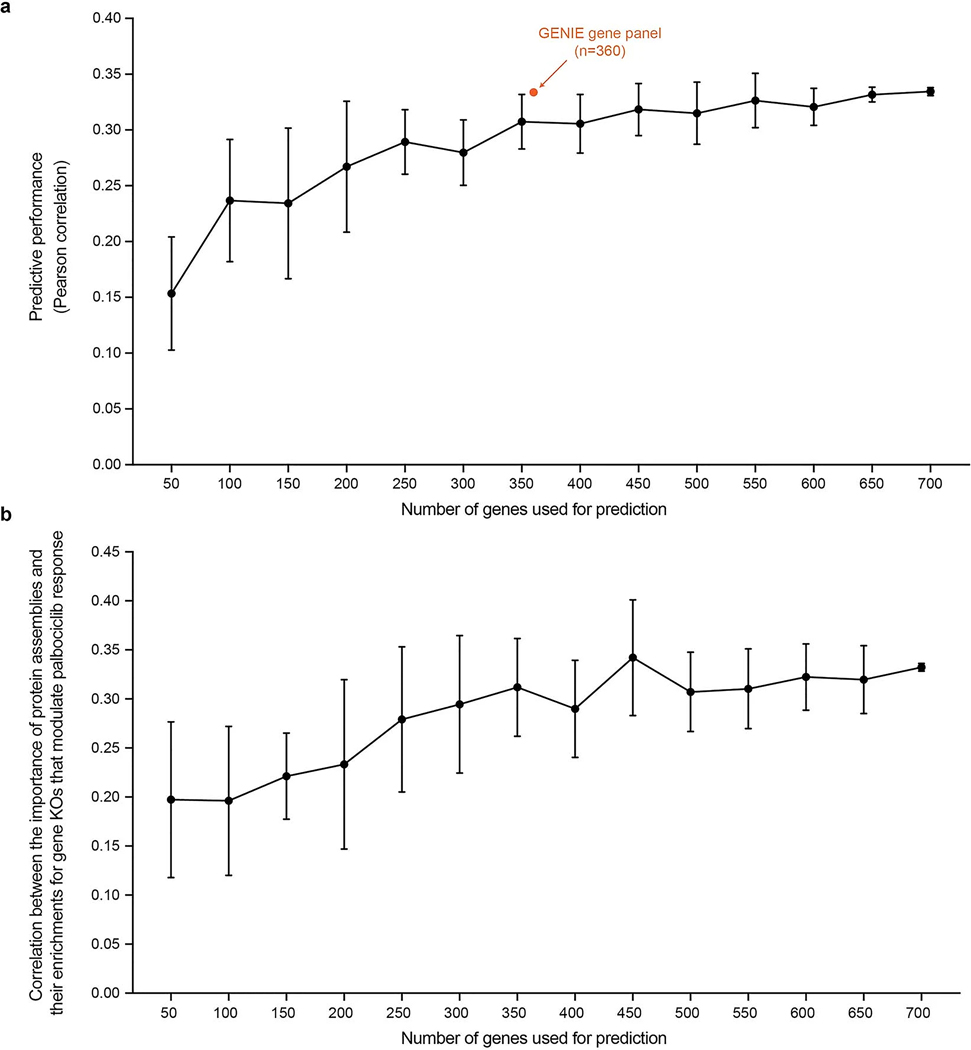
Extended Data Fig. 5 |. Supplemental analysis of NeST-VNN robustness.
a, Predictive performance of NeST-VNN according to the number of genes used for prediction. Predictive performance is defined by the Pearson correlation between the predicted and actual drug responses. Each point represents the average predictive performance (y-axis) from 10 repeated experiments, with each experiment drawing a different random selection of genes of a given set size (x-axis). The error bar indicates the standard deviation of the predictive performance across these experiments. The orange point indicates the predictive performance (Pearson ρ = 0.33) using the GENIE gene panel (n = 360) for prediction. b, Correlation (Pearson ρ) between the importance of protein assemblies for model prediction and their enrichments for gene KOs that modulate palbociclib response (y-axis) as a function of the number of genes used for prediction (x-axis). Each point represents the average Pearson correlation from 10 repeated experiments, with each experiment drawing a different random selection of genes of a given set size. The error bar indicates the standard deviation of the Pearson correlation across these experiments.

