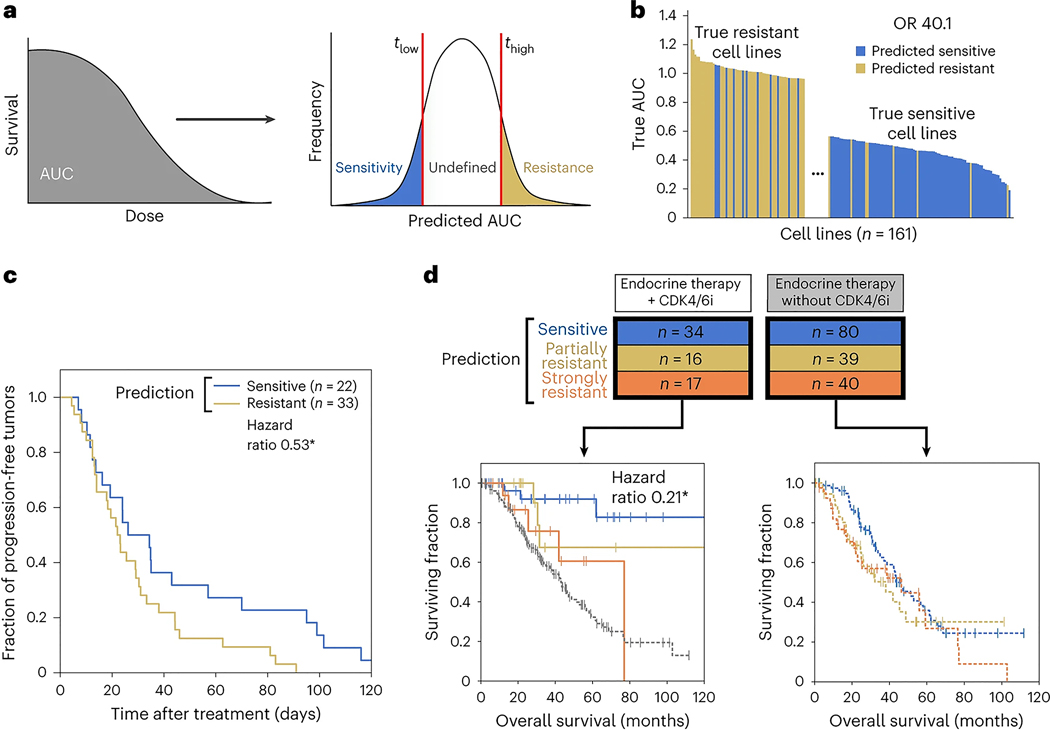
Fig. 2 |. Predictive performance of the palbociclib model.
a, Scanning cell survival to measure a continuous AUC that is thresholded to assign class labels (sensitive, undefined or resistant). b, Waterfall plot showing the true dose responses of tumor cell lines, with colors indicating the predicted class of each. Predicted AUC is thresholded to produce class labels (sensitive, resistant; see text). c, Survival curve analysis for predicting the sensitive or resistant status of PDX samples. *P < 0.05 by log-rank test. d, Survival curve analysis for GENIE clinical trial patients treated with CDK4/6i plus endocrine therapy (left) or endocrine therapy alone (right). Colors denote class labels for predicted CDK4/6i-sensitive (blue) and CDK4/6i-resistant (yellow/orange) patients, with additional stratification of a strongly resistant category (orange). Patients not treated with CDK4/6i therapy are shown in gray. The hazard ratio was 0.21 for strongly resistant versus sensitive predicted subgroups. *P < 0.05 by log-rank test.

