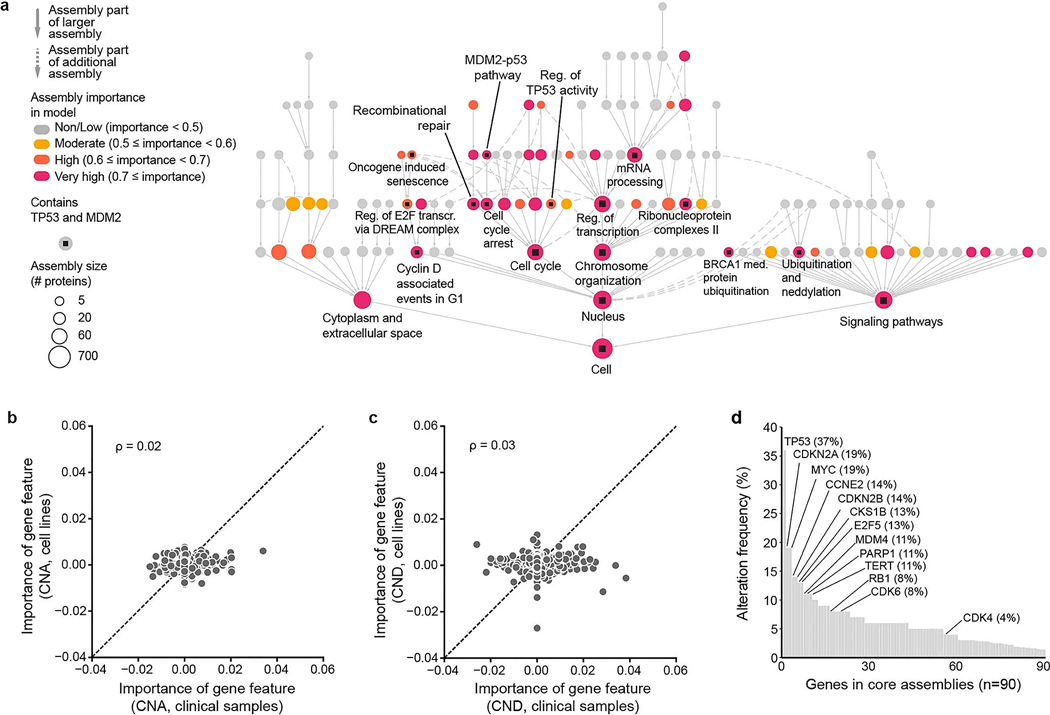
Extended Data Fig. 3 |. Supplemental model interpretation.
a, NeST-VNN interpretation of the Nutlin-3a response. Nodes indicate assemblies; node sizes indicate assembly sizes in numbers of proteins; node colors indicate degrees of importance for response prediction; squares inside the nodes indicate whether the assembly contains TP53 and MDM2, drug targets of Nutlin-3a. b, Scatter plots of gene importance based on copy number amplifications (CNA) in clinical vs. cell line contexts (x vs. y). c, same as panel b except the gene importance is based on copy number deletions (CND). d, Alteration frequencies of genes within core assemblies. Includes somatic mutations, CNA, and CND observed in the TCGA/ICGC pan-cancer data.

