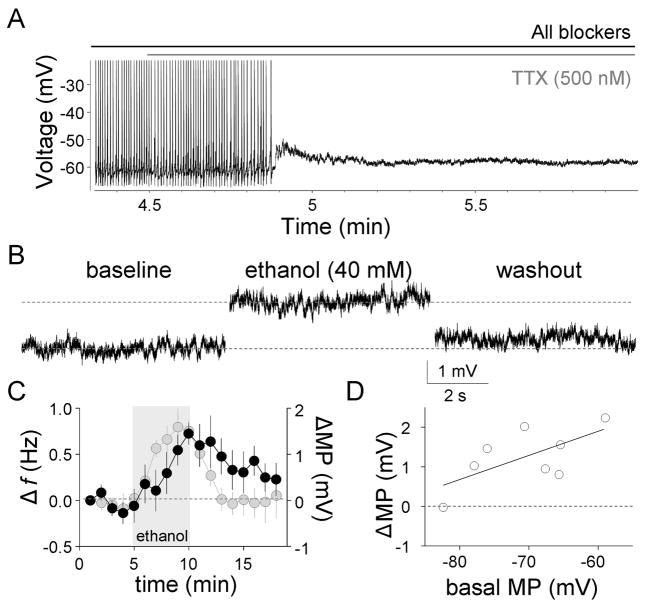
Fig 4. Ethanol depolarizes the membrane potential.
A, Effect of TTX on spontaneous GoC firing (action potentials were truncated for clarity). B. Representative traces illustrating the ethanol-induced membrane potential depolarization. C, Timecourse of the ethanol-induced membrane potential (MP) change (black circle; bin size, 1 min; n = 8). The timecourse of the ethanol-induced Δf (gray circles) from Fig 3B is shown again for comparison (bin size, 1 min; n = 8). D, plot of the ethanol-induced membrane potential change versus basal membrane potential. All these recordings were made in the perforated-patch current-clamp configuration (Iholding = 0). Recordings were obtained in presence of gabazine (10 μM), kynurenate (1 mM), D,L-APV (50 μM), strychnine (1 μM), CGP 54626 (10 μM), LY 341495 (1 μM) and TTX (0.5 μM).

