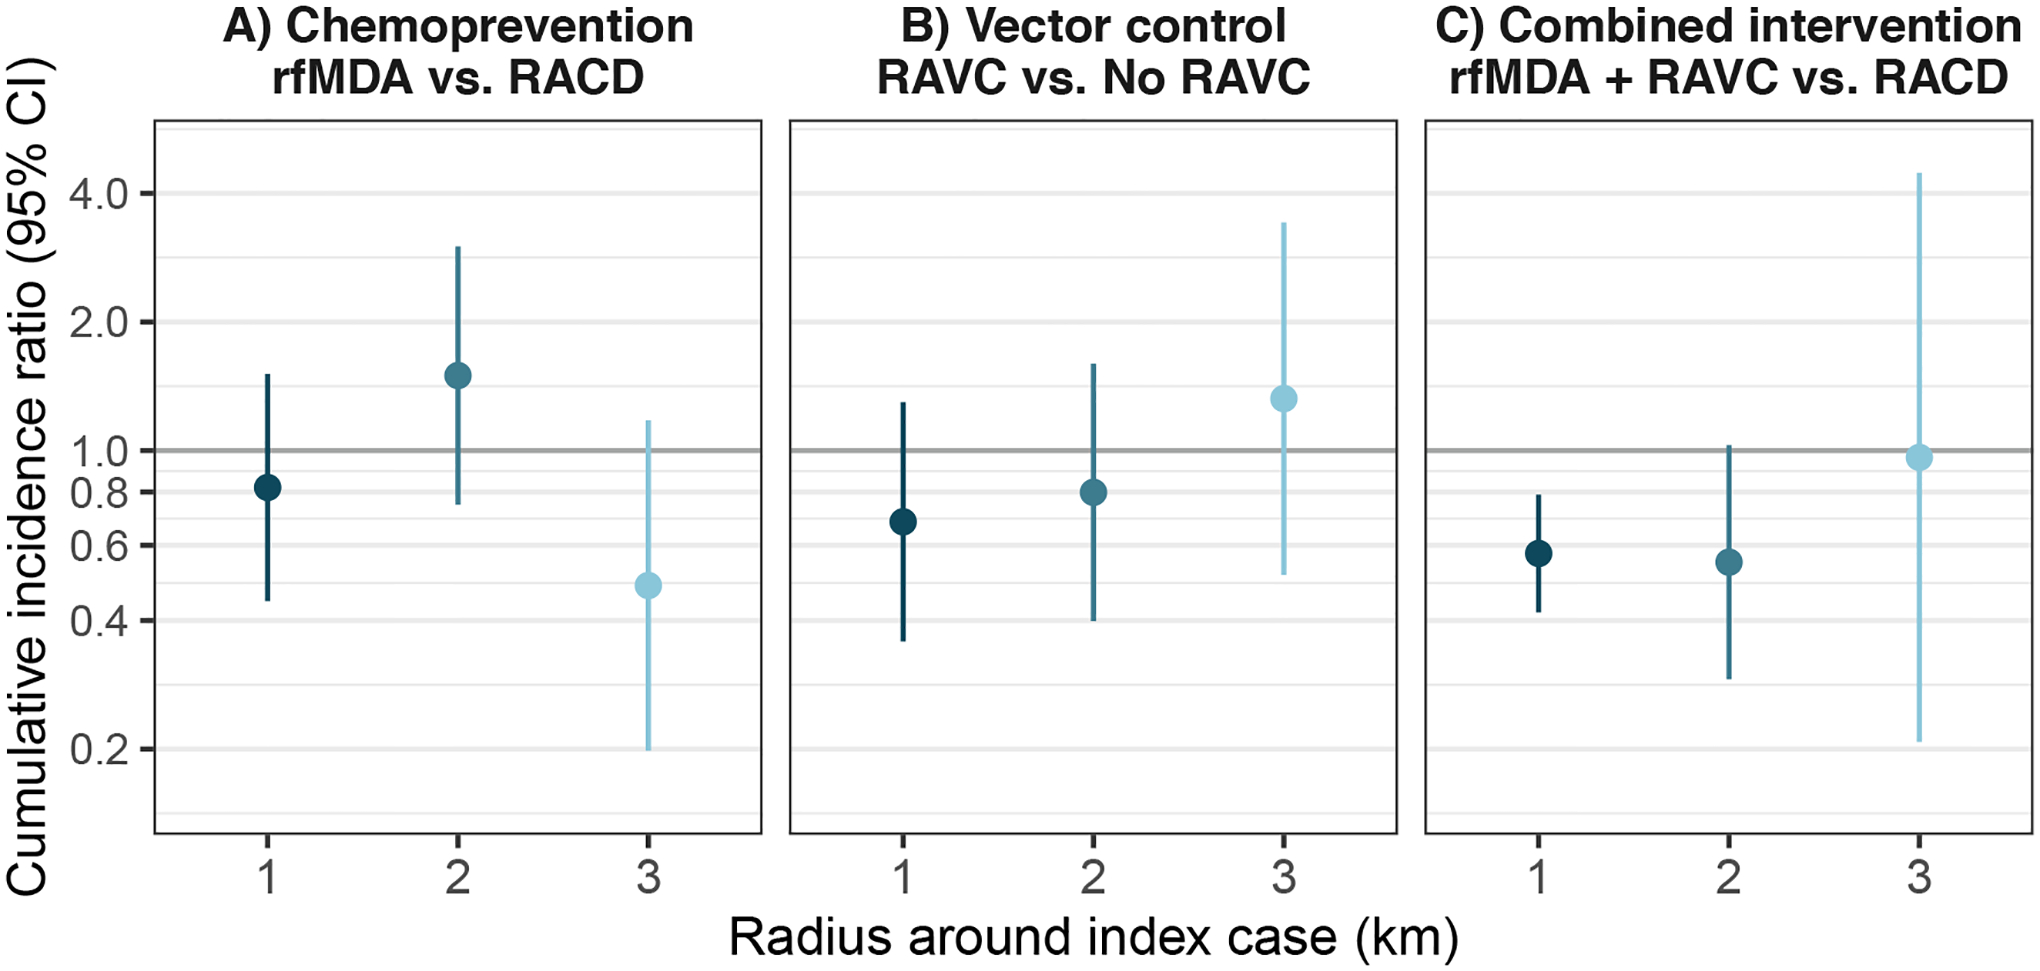
Extended Data Fig. 3 |. Sensitivity analyses for spillover effects on cumulative incidence of malaria with different distance radii.

a) Chemoprevention (rfMDA vs. RACD). b) Vector control (RAVC vs. no RAVC). c) Combined intervention (rfMDA + RAVC vs. RACD only). Data are presented as cumulative incidence ratios between study arms with vertical bars to indicate 95% confidence intervals not accounting for potential outcome correlation. For rfMDA and RACD arms, the primary analysis includes the period from 0–35 days following index case detection for direct effects and 21–56 days for spillover effects (1 km N individuals = 81,082, N cohorts = 310; 2 km N individuals = 59,166, N cohorts = 294; 3 km N individuals = 46,224, N cohorts = 293). For rfMDA+RAVC and RAVC only arms, the primary analysis includes the period from 0–6 months following index case detection for direct effects and 17 days to 6 months for spillover effects (1 km N individuals = 41,962, N cohorts = 143; 2 km N individuals = 24,973, N cohorts =136; 3 km N individuals = 20,249, N cohorts = 138). Total effects analyses include the person-time for the direct effects and spillover effects analyses. Direct effect includes intervention recipients in target zone. Spillover effect includes intervention non-recipients up to 1 km from an index case in the primary analysis and up to 2 km or 3 km in sensitivity analyses. Total effect includes all individuals (intervention recipients and non-recipients) up to 1 km from the index case in the primary analysis and up to 2 km or 3 km in sensitivity analyses. Includes cohort-level analyses for all estimates except spillover effects of the combined intervention. All outcome models were fit with cohort-level data except for models of spillover effects of rfMDA vs. RACD and rfMDA + RAVC vs. RACD only.
